Scripts
Required Dependencies and Plotting Packages
How to run the scripts?
As the graphs are made with data on a date, users need to specify the date when running the script. The date format here is yyyymmdd. For example, if the user wants to have graphs for "12th March 2017", then the date should be "20170312".
Running via Python editors - put this command in any Python 3 console/terminal (e.g. Canopy and Spyder):
- run scriptname.py yyyymmdd
Running via system terminal - put this command in system's terminal:
- python3 scriptname.py yyyymmdd
Description
Scripts are available to download here.
Data are available to download here.
The scripts often produce some warnings about "converting a masked element to nan". This is common and will not affect the results as long as the scripts could fully execute. The scripts will return some information every time a function is executed. Some scripts may take over 2 minutes to execute due to a large amount of calculation. All the scripts will save the plots automatically. Some plots are of high resolution and it may take a few minutes to save the plots. A "One-Click" function is enabled in some scripts (described below). Users can use this function to view the vertical profiles at a selected time. Please note that due to some unknown issues in Copernicus data, there may be some small shifts in time pixels.
Please note that the "One-Click" function may not work on Jupyter Notebook, as figures are not plotted in an external window.
| Script Name | Description/Purpose |
|---|---|
| identify_BB_VPR.py | This script marks the bight band locations using the VPR Algorithm. In this script, the first derivative and the second derivative of $Z_{linear}$ are calculated. A "One-Click" function is enabled. Hence, this script can also plot vertical profiles of $dBZ$, $Z_{linear}$, the first derivative of $Z_{linear}$ and the second derivative of $Z_{linear}$ at a selected time. Figures will be saved as "BB_VPR_yyyymmdd.pdf" |
| identify_BB_Vel.py | This script marks the locations of bright band top and bright band bottom using the Velocity Algorithm. A "One-Click" function is enabled. Hence, this script can also plot vertical profiles of the fall velocity at a selected time. Figures will be saved as "BB_Vel_yyyymmdd.pdf" |
| identify_BB_combined.py | This script marks the bright band locations using the Combined Algorithm. A "One-Click" function is enabled. Hence, this script can also plot vertical profiles of $dBZ$, $Z_{linear}$, the first derivative of $Z_{linear}$ and the fall velocity at a selected time. Figures will be saved as "BB_combined_yyyymmdd.pdf" |
| import_radar_disdrometer.py | This script plots time series of the observations of Copernicus and the disdrometer. Figures will be saved as "radar_disdrometer_yyyymmdd.png". |
| identify_BB_strength.py | This script marks the bright band locations and its "strength" using the Ongoing Algorithm. A "One-Click" fucntion is enabled. Hence, this script can also plot vertical profiels of the fall velocity and its first derivative with a 360-m interval (this interval can be changed in the script) at a selected time. Figures will be saved as "BB_strength_yyyymmdd.pdf". |
The "One-Click" Function
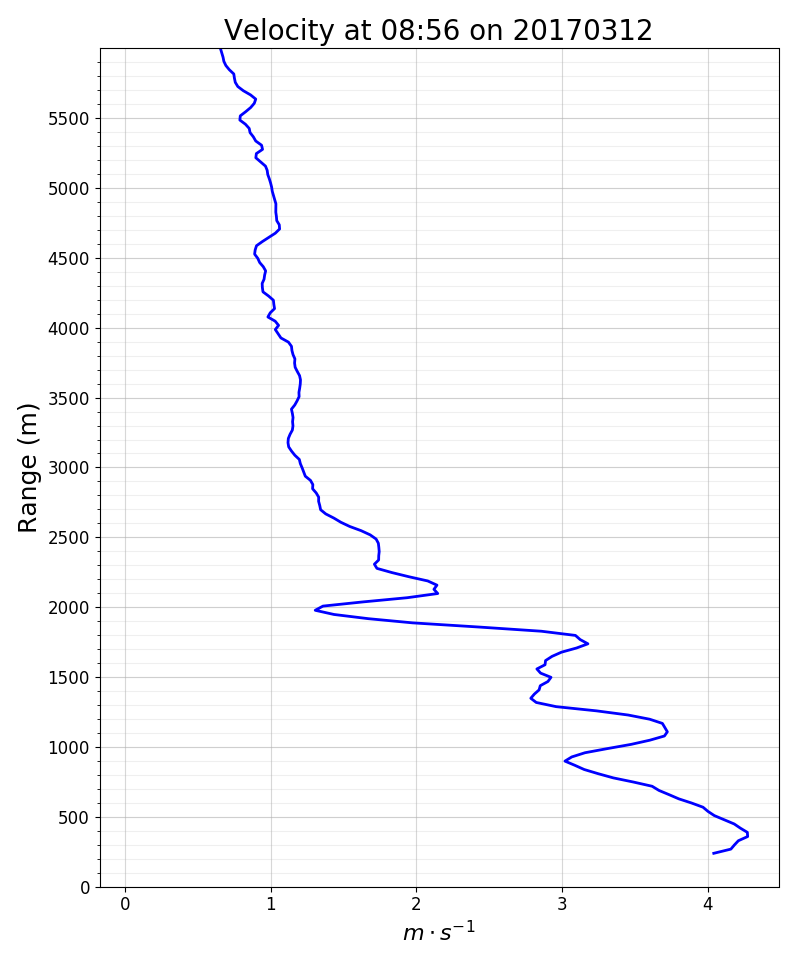
This function enables users to view the vertical profiles of the variables. It will be called every time when the script is executed and the principal plotting is done. Users can click at any place on the figure and then the vertical profile at the time the user clicked will be plotted. For example, if a user is interested in the vertical profiles at 9:00 AM, then the user needs to click somewhere near 9:00 AM. The range where the user clicked will not affect the results. Only the time coordinate matters in this function. The code below is an example of this function. The vertical profile of the fall velocity would be plotted if the user clicked the figure. Note that the results produced by this function will not be saved automatically.
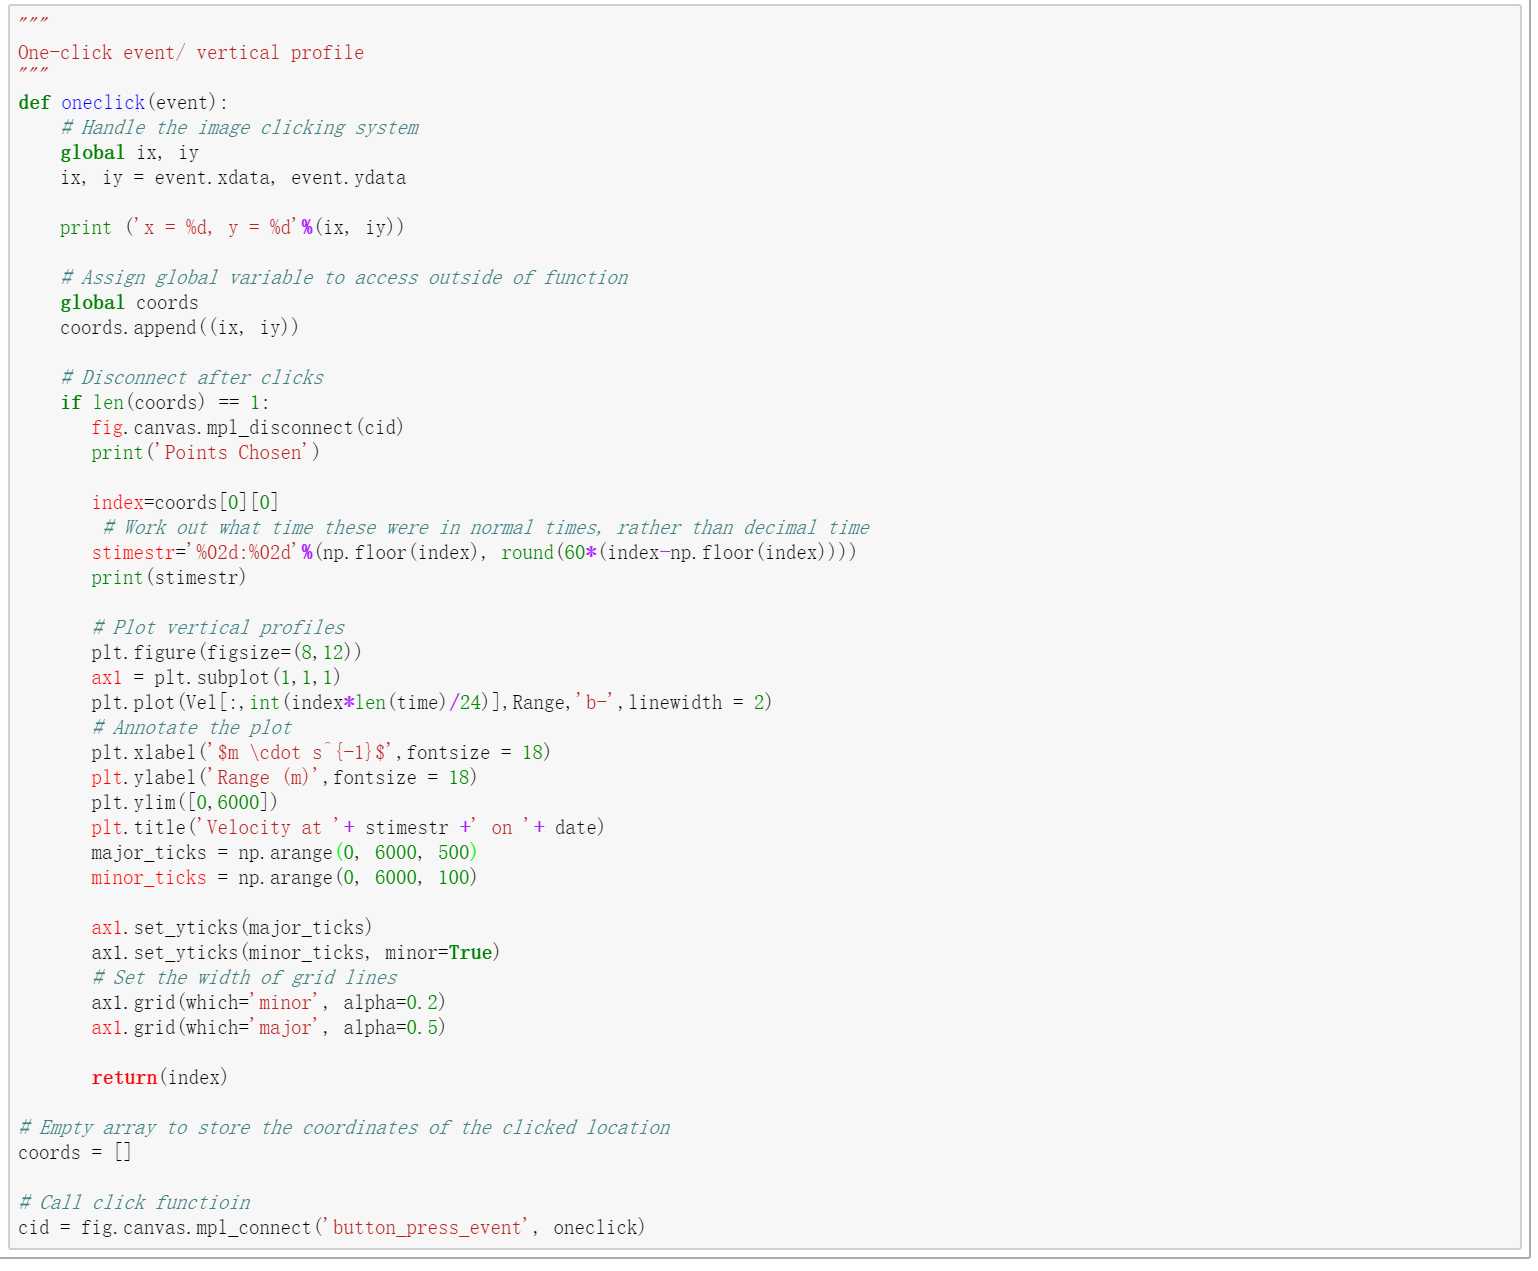
Example result: