Observations of Copernicus Radar and the Disdrometer
The following results are produced using this script: [import_radar_disdrometer.py].
A disdrometer of DiVeN is installed at the CFARR, approximately 200 m away from the Copernicus Radar. The observations of this disdrometer and the Copernicus on 12th March 2017 are shown in Figure 12. Between 4:00 and 6:00 AM, the disdrometer observed a small number (below 50) of small drops (diameter below 0.75 mm). This is not well-pronounced in the rainfall rate profiles, but the logarithmic scale of rainfall rate (Figure 12b) shows that the rainfall rate during this period is not zero. These small values could be due to light drizzles. Hence, it is assumed that there exists a correlation between bright band strength and precipitation intensity. Although some literature, e.g. Sarma et al. (2016), already suggested that there is a correlation between the bright band strength and precipitation intensity, those results were analysed manually and still were case studies. This project, however, aims to determine this correlation programmatically. This is still an ongoing work.
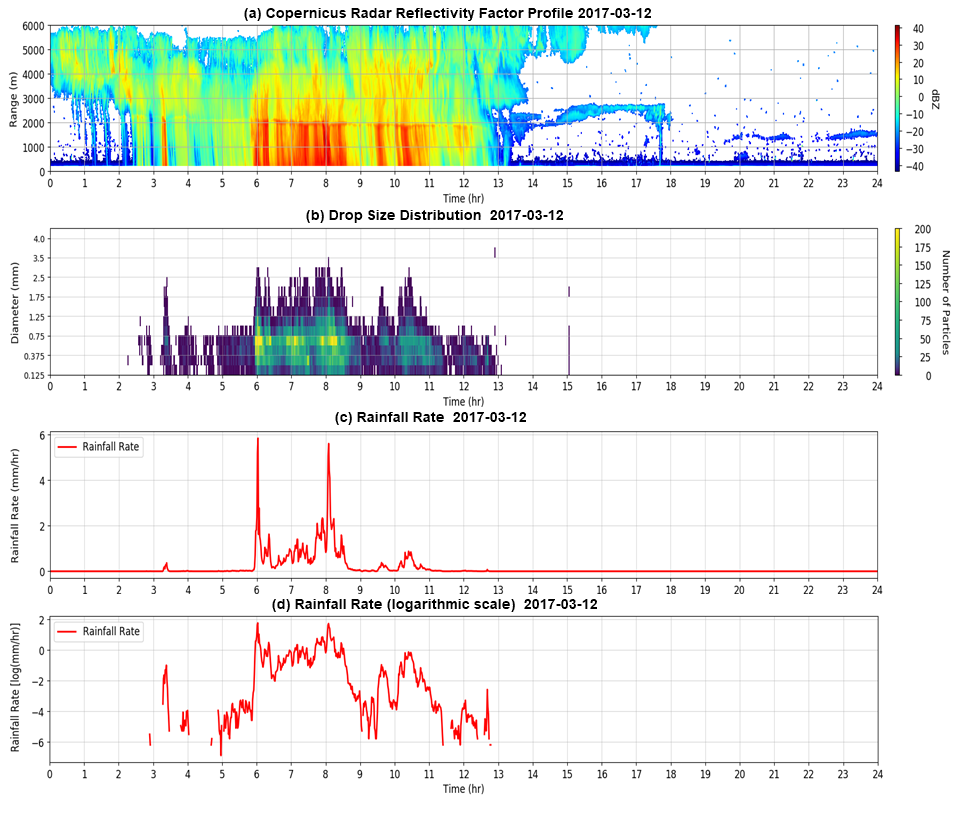
Figure 13: Time series of Copernicus radar refelctivity factor profile (a), drop size distribution (b), rainfall rate (c), logarithmic rainfall rate (d) at CFARR on 12th March 2017. Three bottom panels are plotted using the disdrometer data.