The Nucleation of Particulate FeS Observed with Small
and Wide Angle X-Ray scattering
(SAXS/WAXS)
Liane G. Benning1, Sam Shaw2,
Nick J. Terrill3
1School of Earth Sciences, University of Leeds, Leeds, LS2 9JT, UK
(liane@earth.leeds.ac.uk),
2 Department of Earth Sciences, University of Manchester, Manchester,
M13 9PL, UK
3 Daresbury Laboratory, CCLRC, Warrington, WA4 4AD, UK
SAXS/WAXS experiments can be used
to monitor nucleation reactions at times scales of several 10 to 100's
of milliseconds. Preliminary test runs show that in the FeS system
at low pH and low concentrations, nucleation occurs after about 30 milliseconds
and the main precipitation is over within about 20 milliseconds.
However, in some cases, part of the precipitate seem to re-dissolve in
the next 100 milliseconds before equilbrating as the final product.
This process is presumably attributable to localized changes in pH.
At higher pH the initial precipitation process seems to take longer (~
60 msec.) as a plot of integrated intensities of 200 injection
cycles shows. However, note that due to oscillatory effects
from the mica windows these results could be erroneously interpreted as
changes in SAXS patterns.
The reactions to precipitate colloidal
iron sulphide particles is fast and aggregation over longer time scales
needs to be accounted for. Further work will concentrate on determining
the kinetic reaction rates for these reactions and also onto trying to
improve the various characteristics of the stopped-flow capabilities on
station 8.2 of the
Daresbury Laboratory and stations ID2
and BM26
at the ESRF.
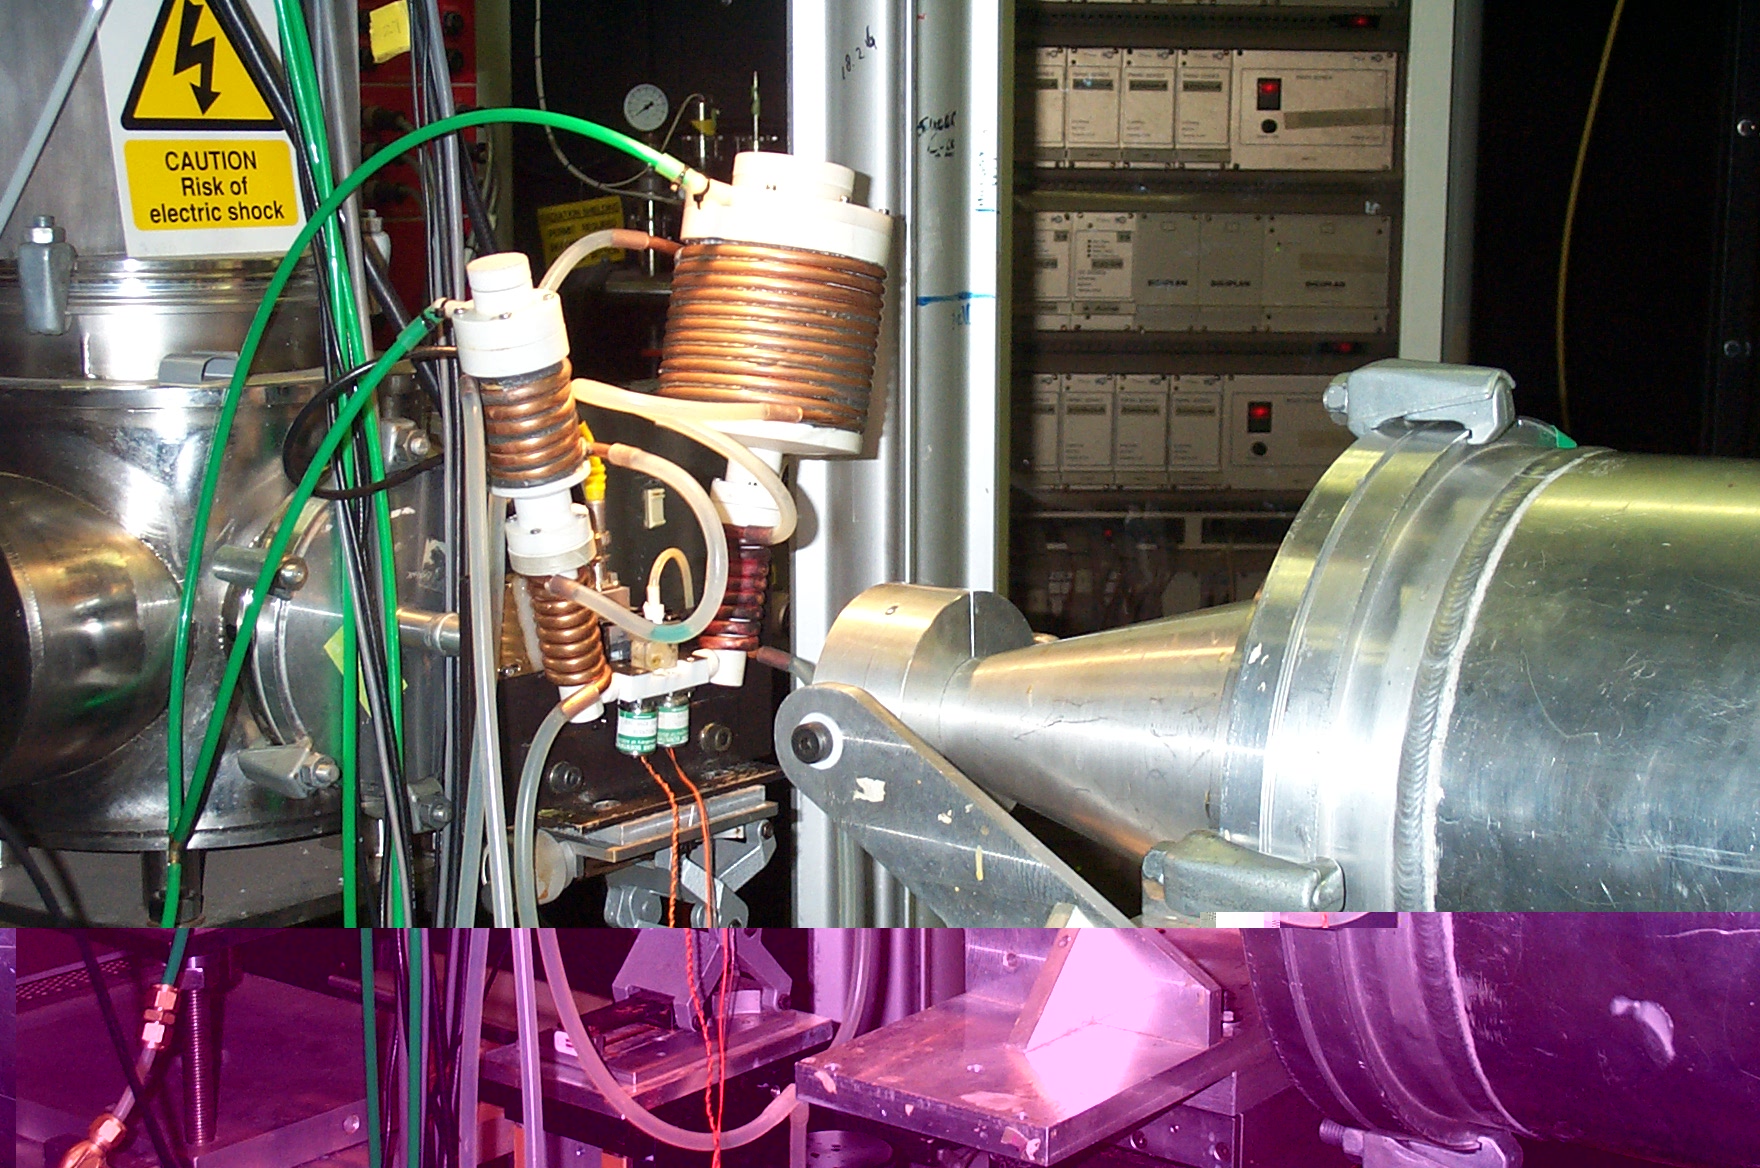
Fig. 1. Details of the stopped-flow cell system mounted on station
8.2.
Shown are the two solution containers (connected to a N2 back pressure),
the remotely
triggered solenoids and the perspex cell where the in situ precipitation
occurs.
The beam passes through the cell before being collected on the SAXS
and
WAXS detectors (courtesy of NDC, SRS Daresbury).
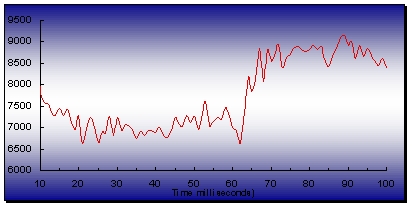
Fig. 2. A 2 D plot of the change in integrated intensity of the
SAXS
Fig. 3. Stacked SAXS patterns for a run with a single injection/cycle
patterns for the first 100 msec (pH=7, dead time = 10 msec,
that was left to develop over several hours. The y-axis is
intensity
accumulated for 200 cycles. Note that the windows of the stopped-flow
(arbitrary units). The observed relative increase in intensity with time
cell are made of mica and vibrational effects can not be ruled
out.
can be interpreted as aggregation of fast precipitated nano - particles
Therefore, particularly the data from the very fast kinetics
into larger clusters.
experiments have to be interpreted with caution.