Splitting a continent
FIGURES AND PHOTOGRAPHS
Photographs and images may only be used if the name of the scientist who took the photograph or prepared the figure is also published. Click on the images for a print-quality version.
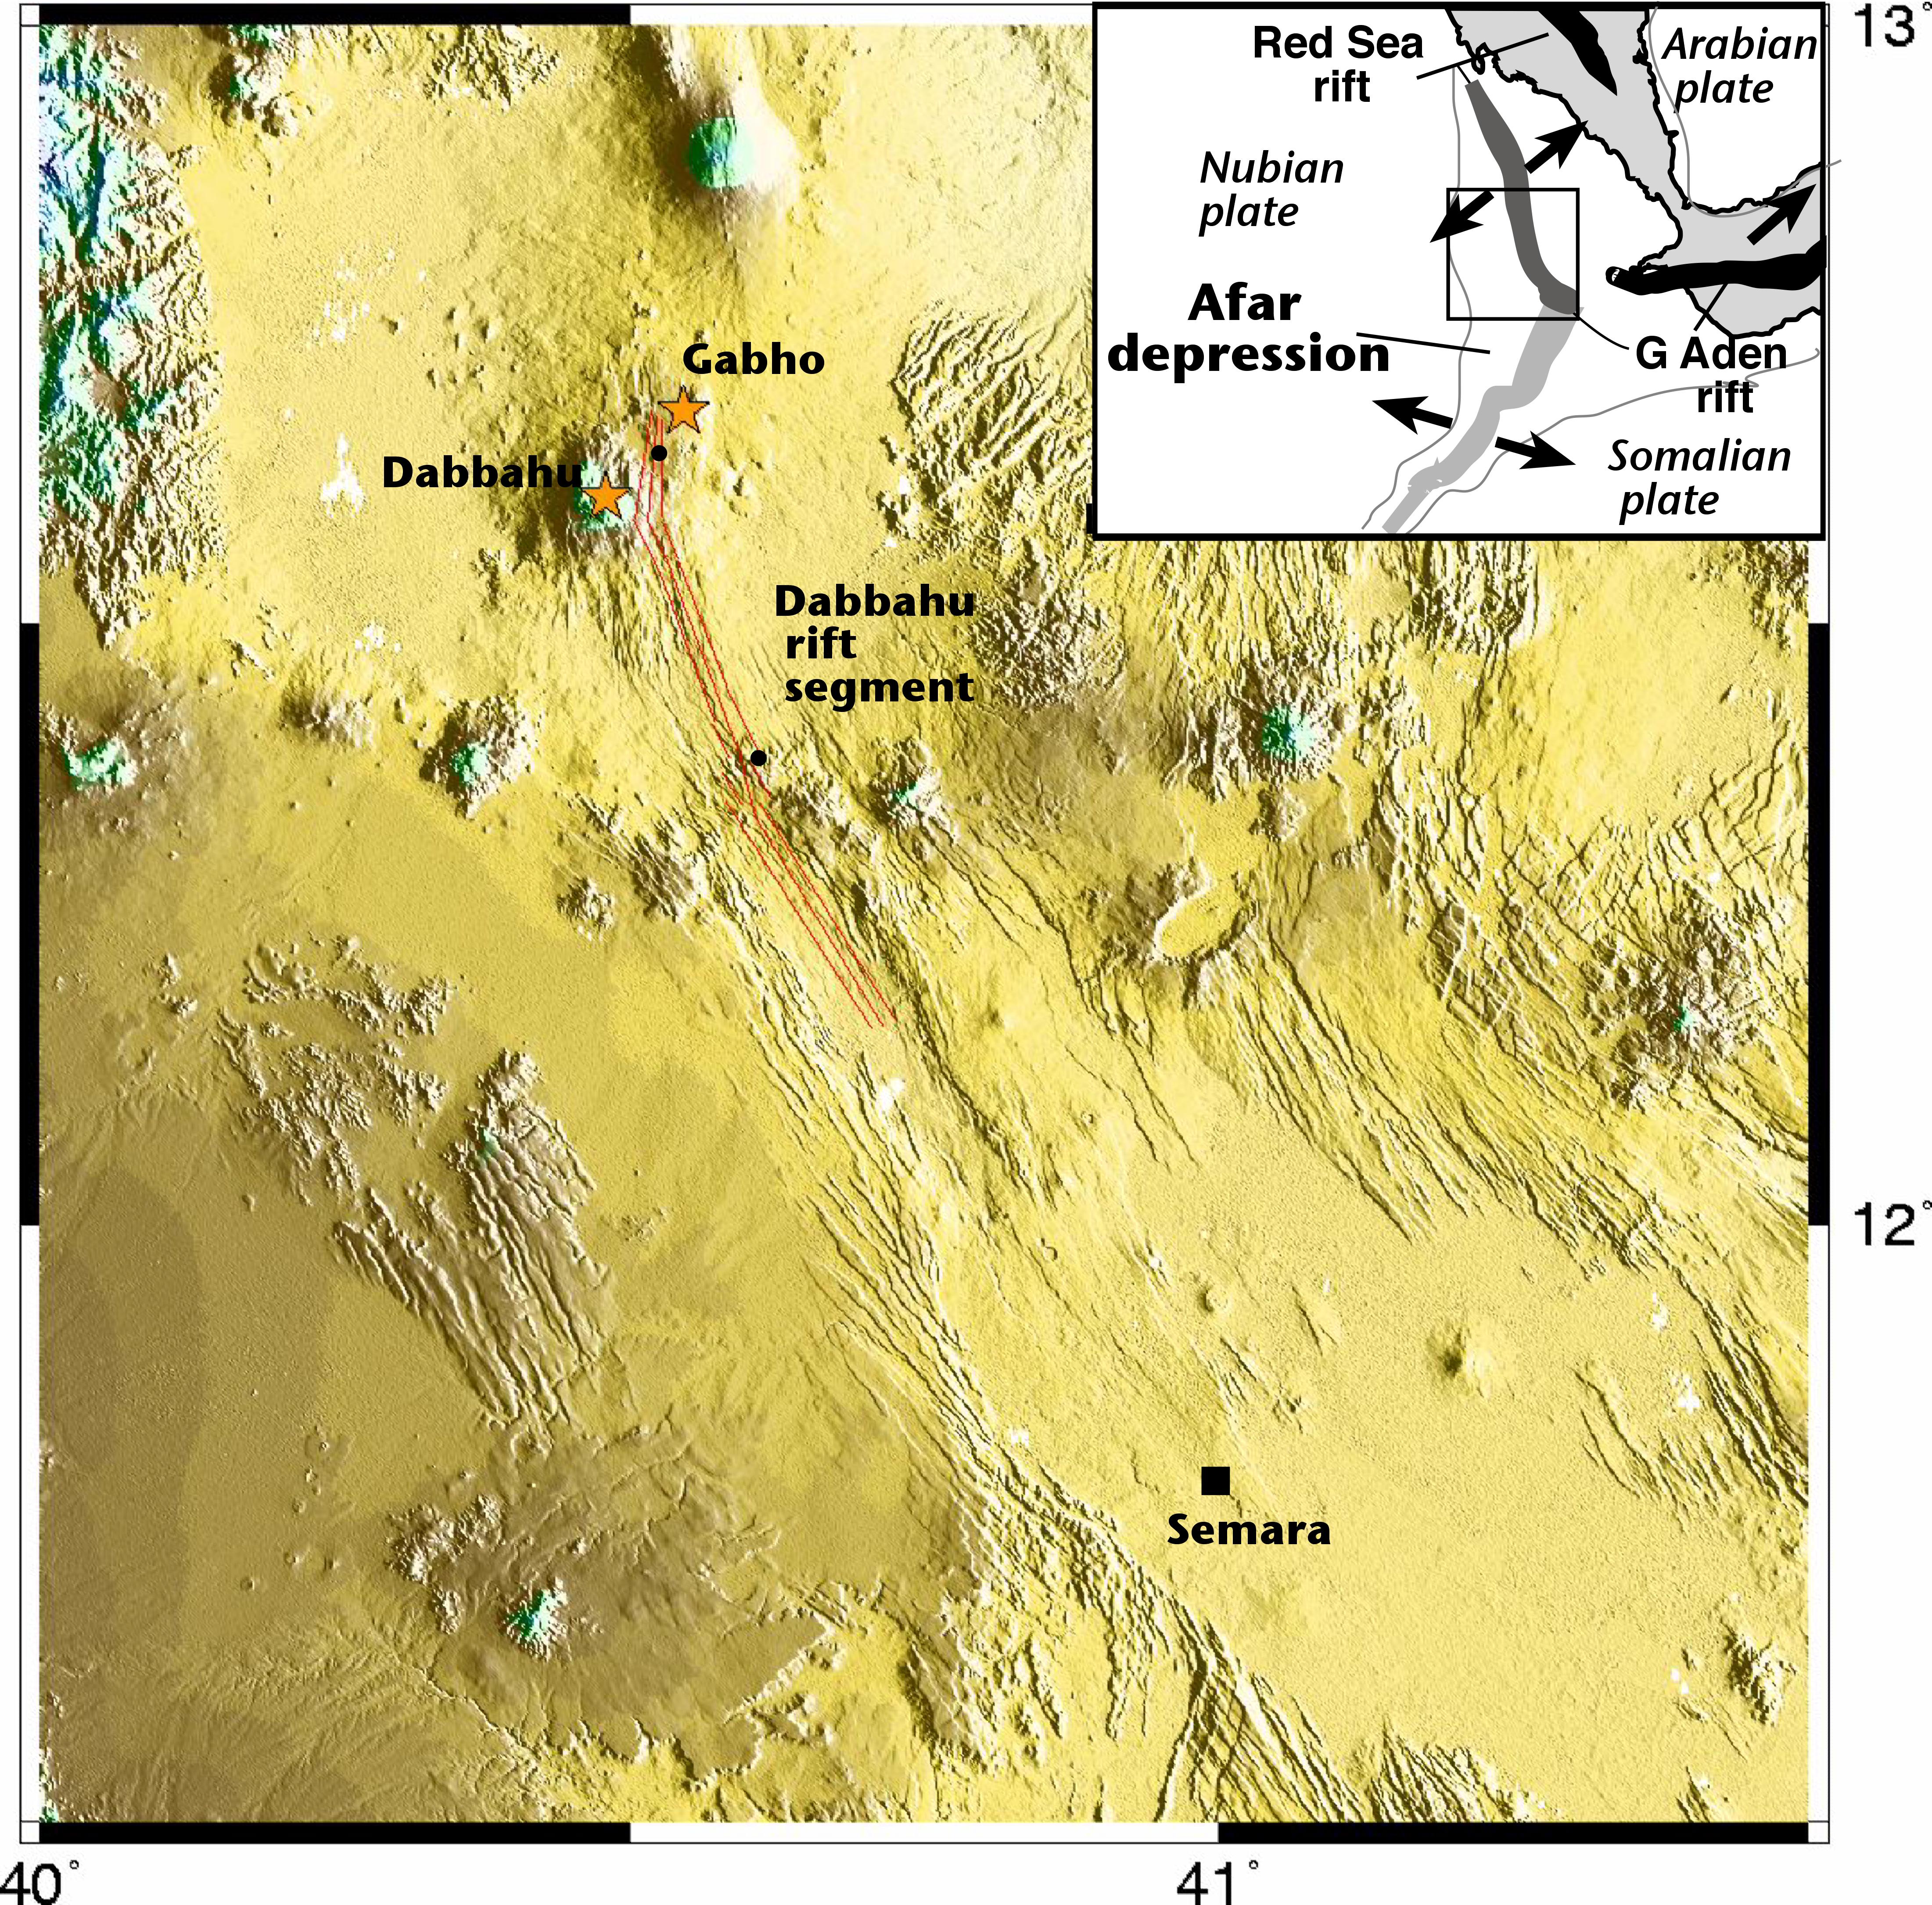
Figure 1. Topographic relief of the 60 km-long Dabbahu rift segment within the Afar Depression. Inset shows directions of plate divergence between the stable African (Nubian), Arabian, and Somalian plates. Cynthia Ebinger, University of Rochester, New York.
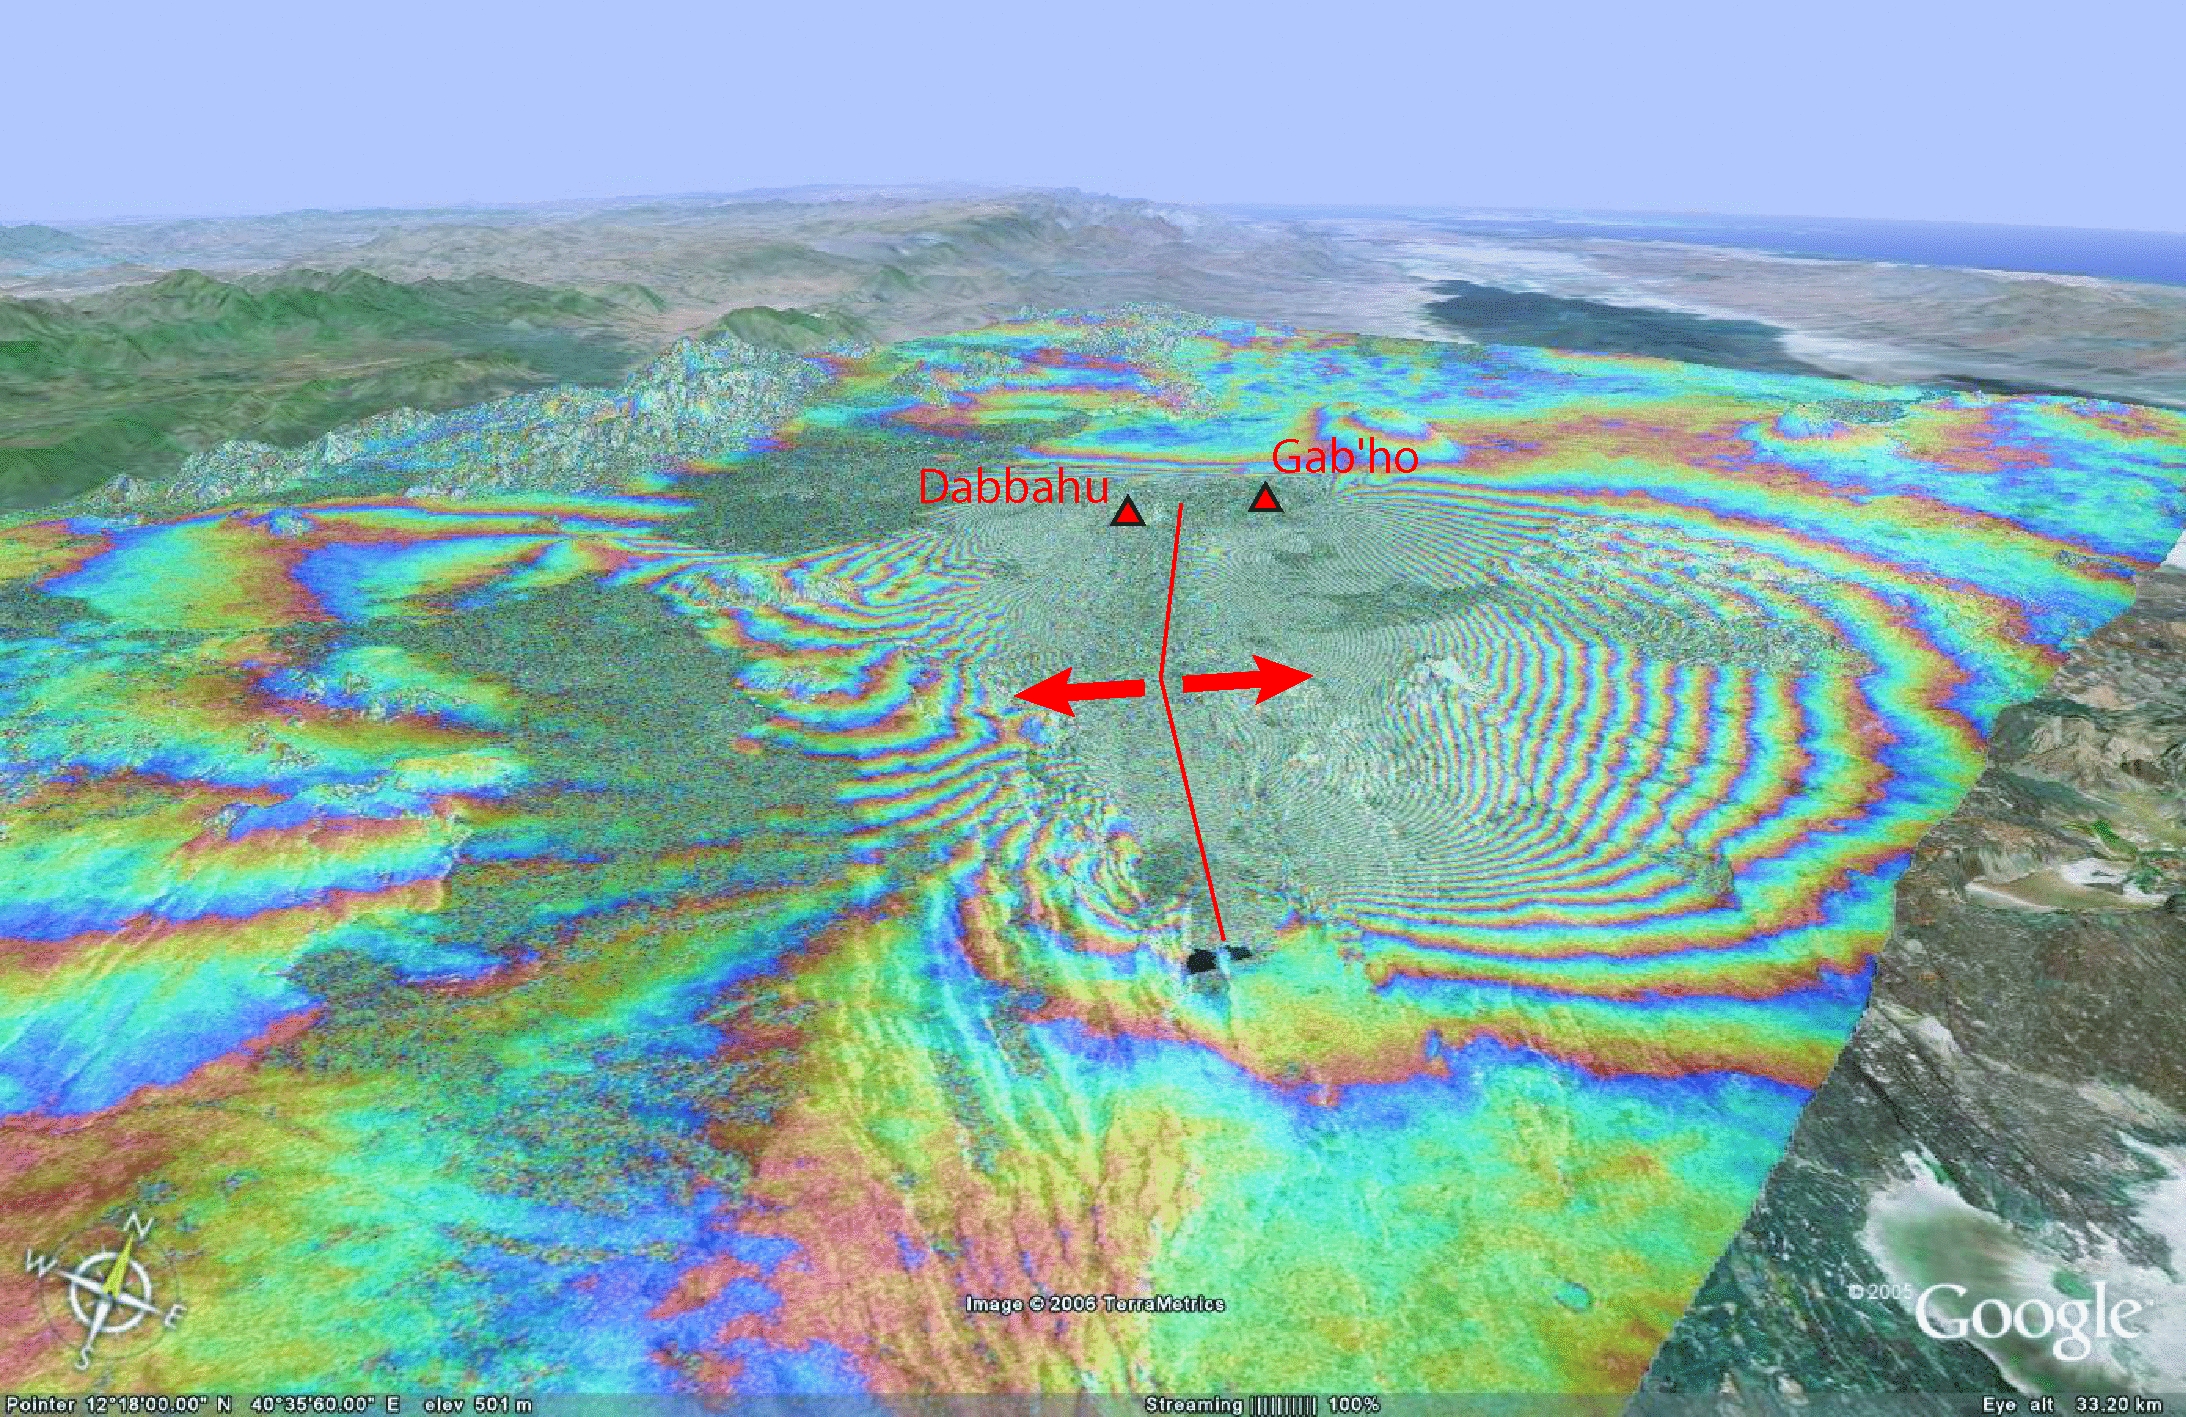
Figure 2. 3D view of satellite radar measurements of how the ground moved in September 2005. Over about 3 weeks, the crust on either side of the rift moved apart by as much as 8 metres, with molten rock filling the crack between the plates. Satellite radar data is from the European Space Agency's Envisat satellite. Figure was prepared by Tim Wright, University of Leeds using Google Earth. Images can be viewed in Google Earth by following the instructions here.
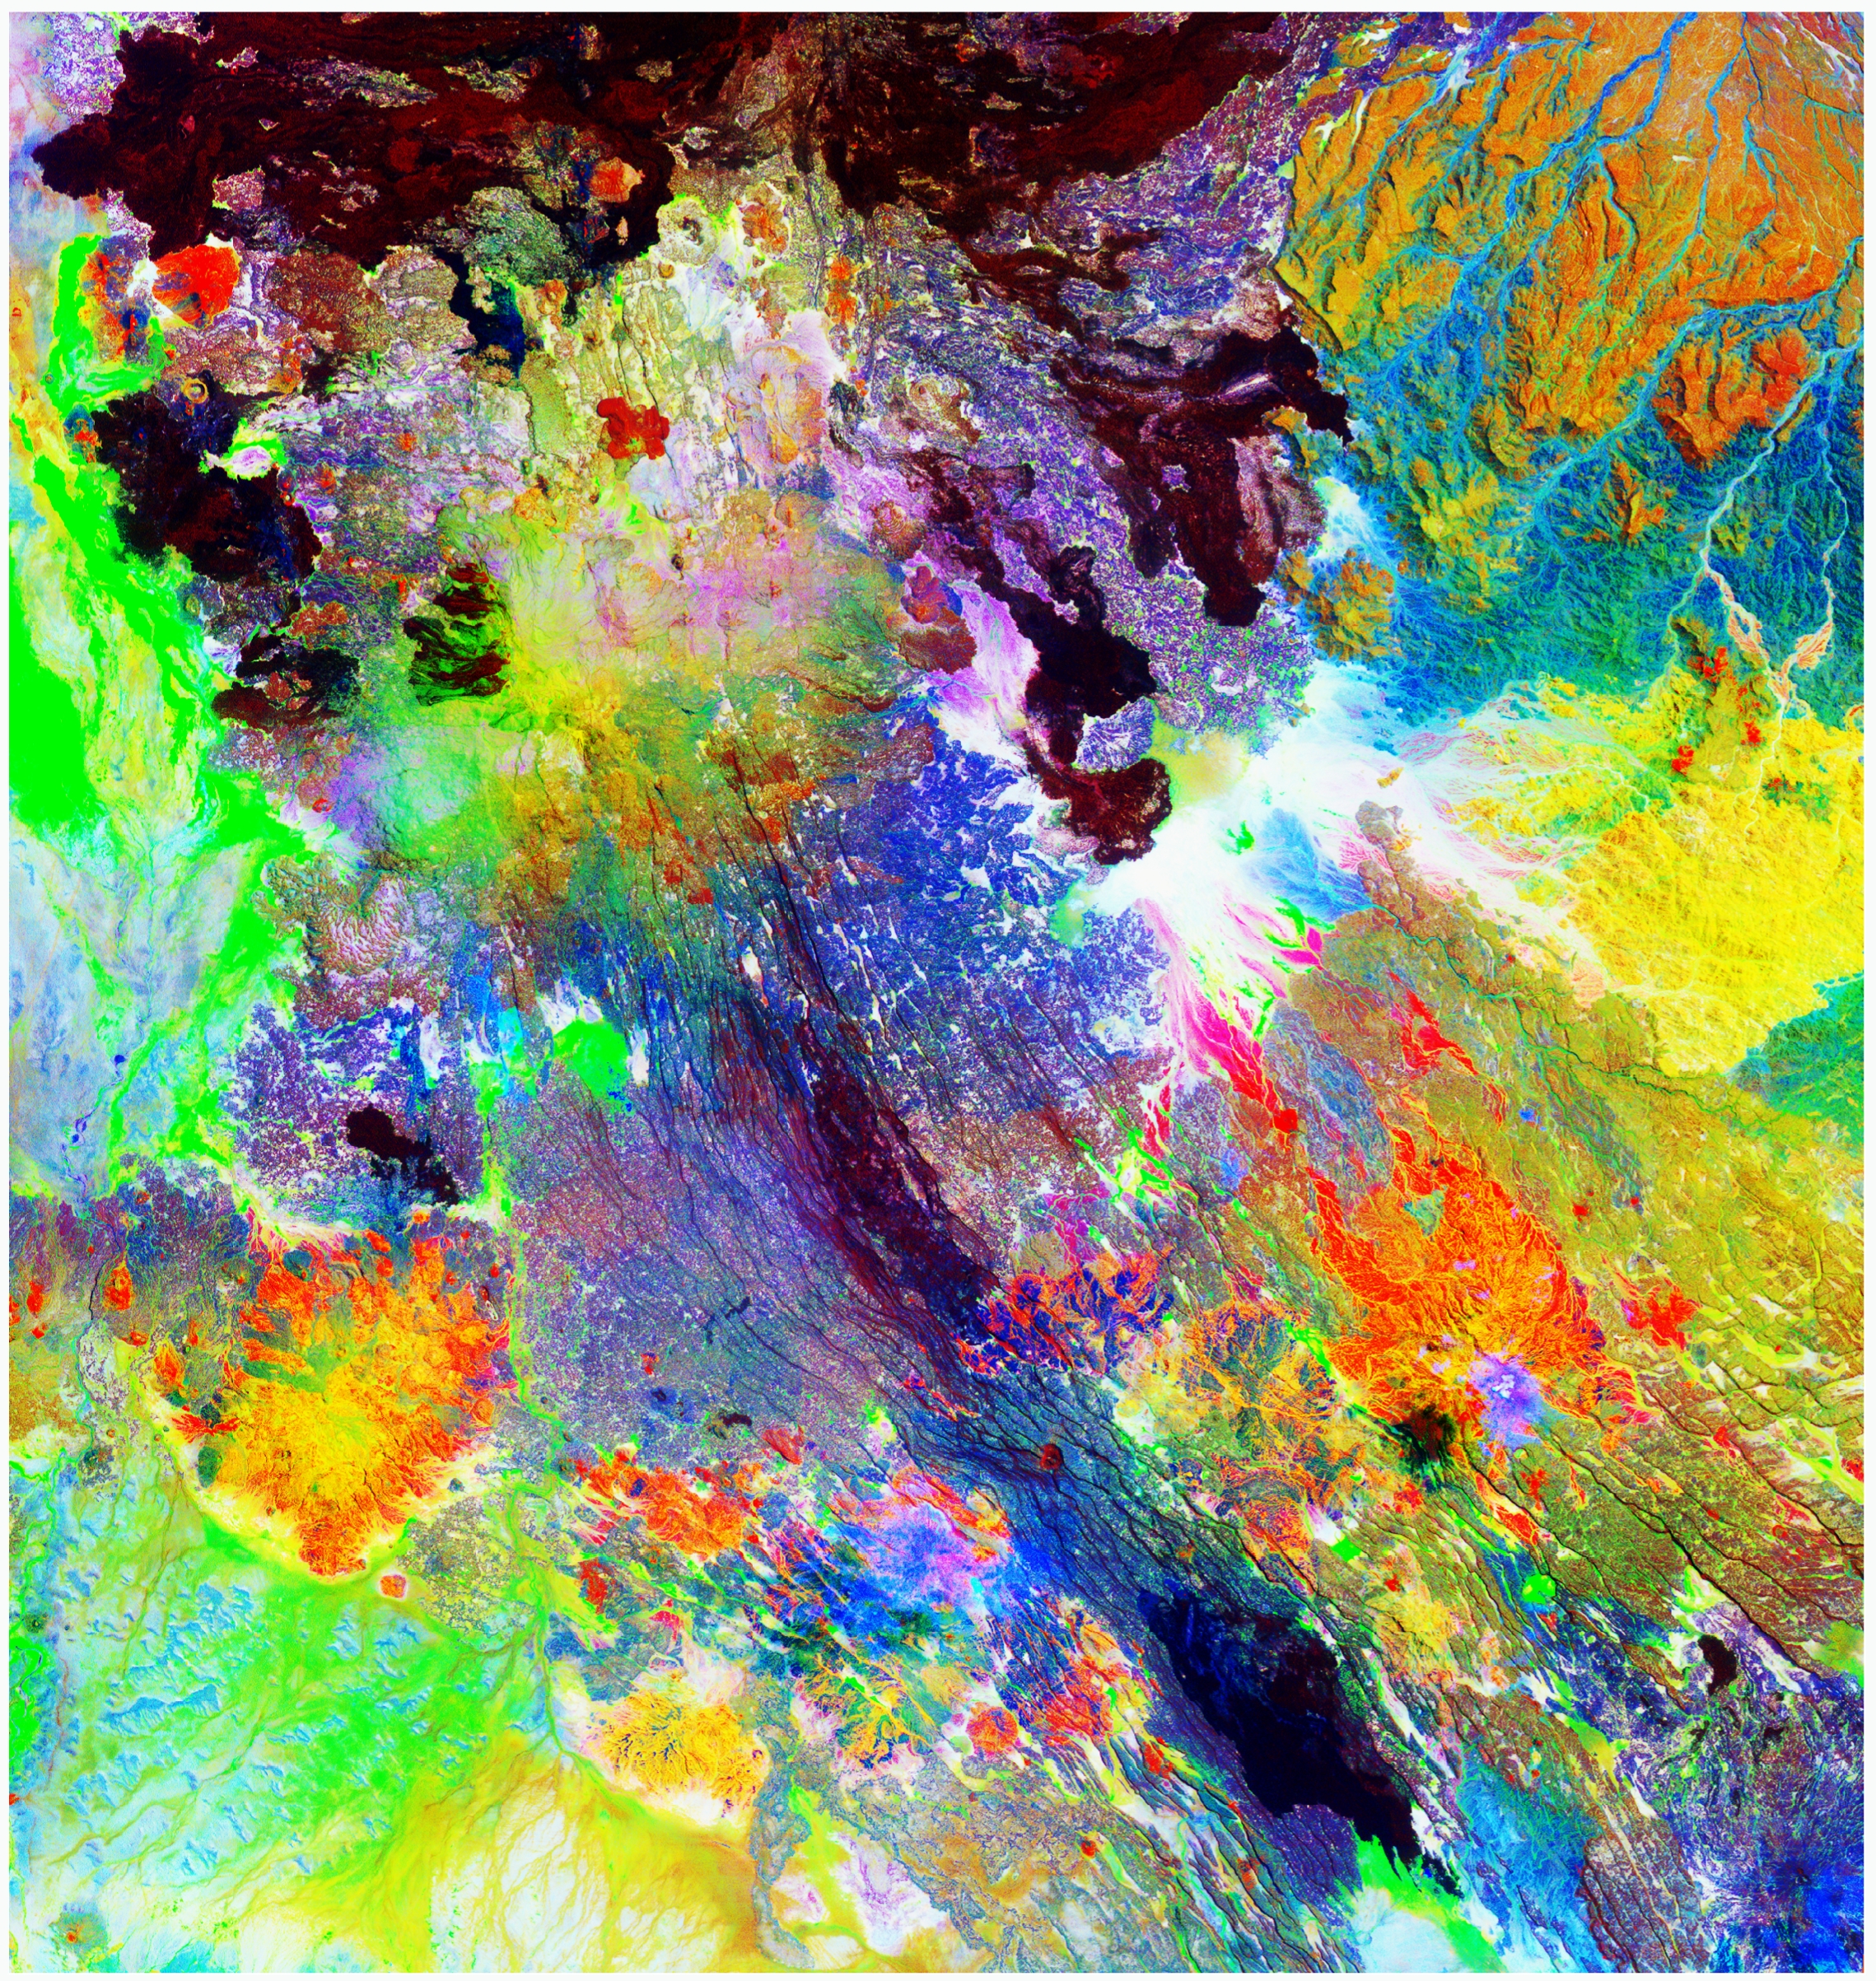
Figure 3: Enhanced Landsat Thematic Mapper image of the Dabbahu rift segment prior to the September 2005 events. These satellite images have been enhanced to show subtle differences in rock type invisible to the naked eye. (Bands 7, 4, 1, decorrelation stretch). Ellen Wolfenden, Royal Holloway, University of London.
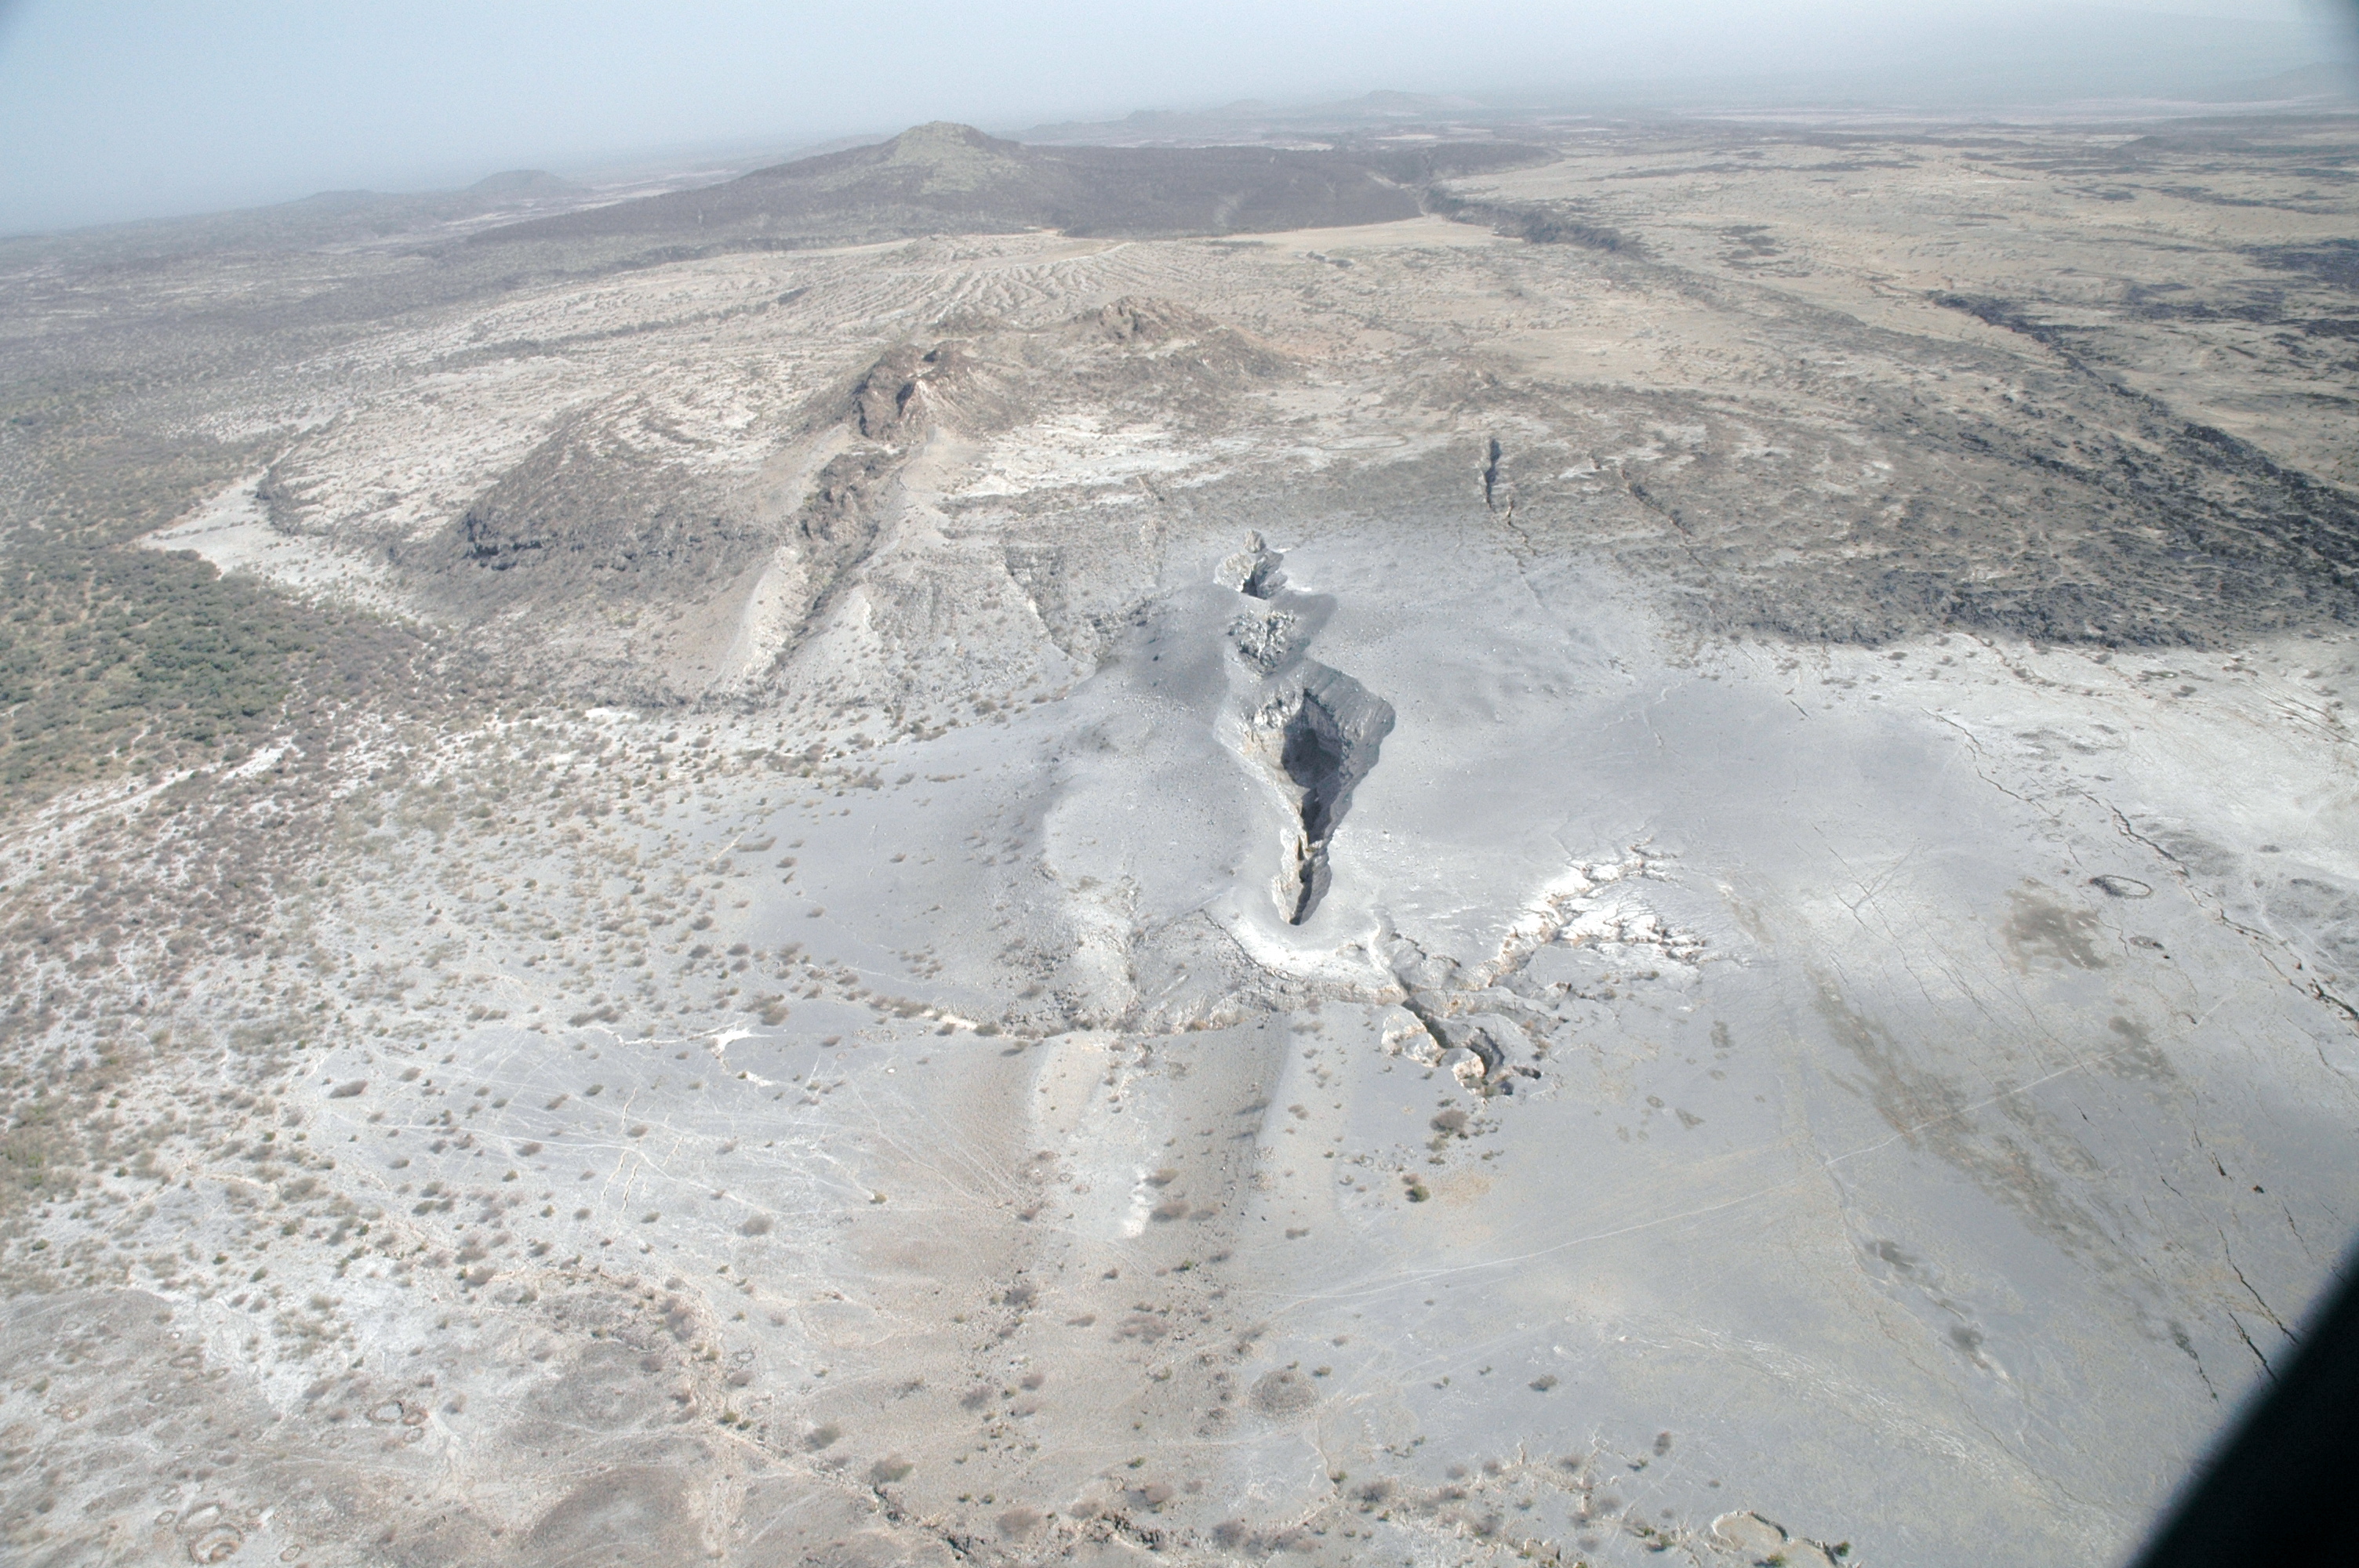
Figure 4: Photo looking N of the explosive vent that opened on September 26 after two days of nearly continuous seismic activity. To the right of the ~60 m-wide vent lies a 200 m-wide, 4 km-long zone of open fissures and normal faults that may mark the subsurface location of the dyke. The fault zone continues to the top of the photo to the right of the small rhyolite centre. Photo Elizabeth Baker, Royal Holloway, University of London.
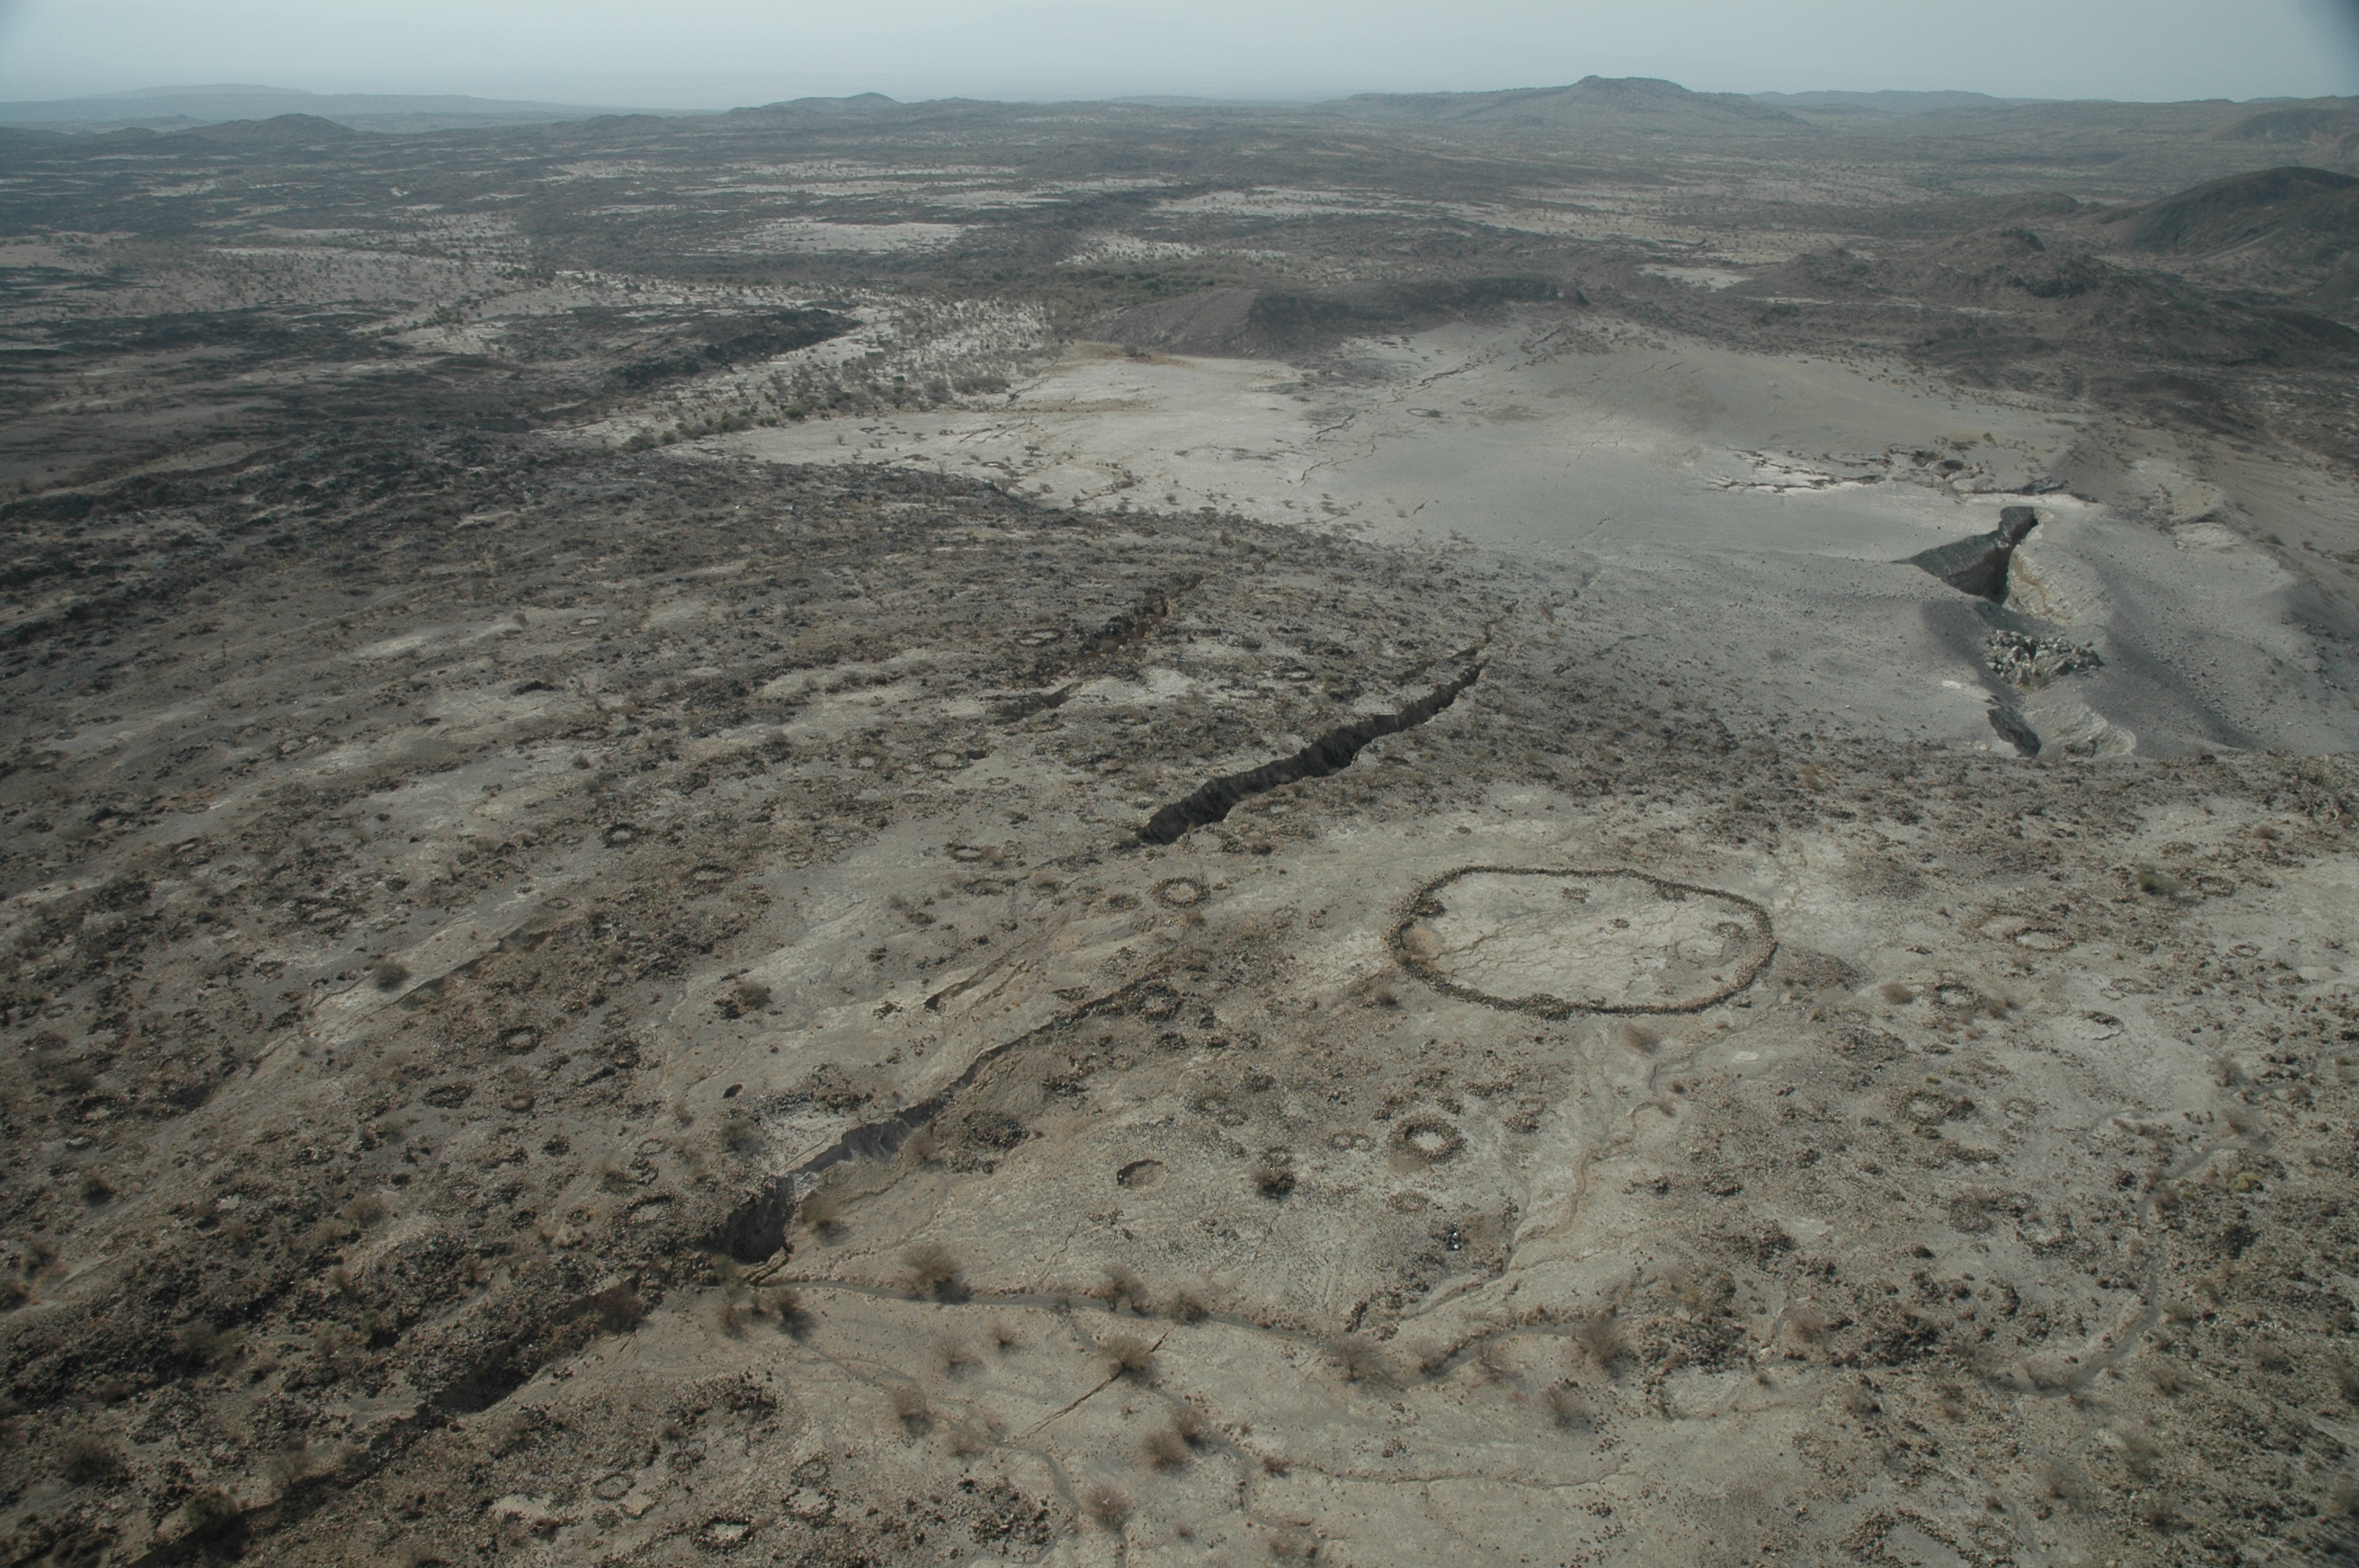
Figure 5: Aerial photograph looking NW toward the September 26 volcanic vent. The area of buff-coloured material is some of the volcanic ash deposited after the volcanic eruption. Note the open fissures both to the north and south of the vent. Additional cracks are located to the east (right). Photo Elizabeth Baker, Royal Holloway, University of London.
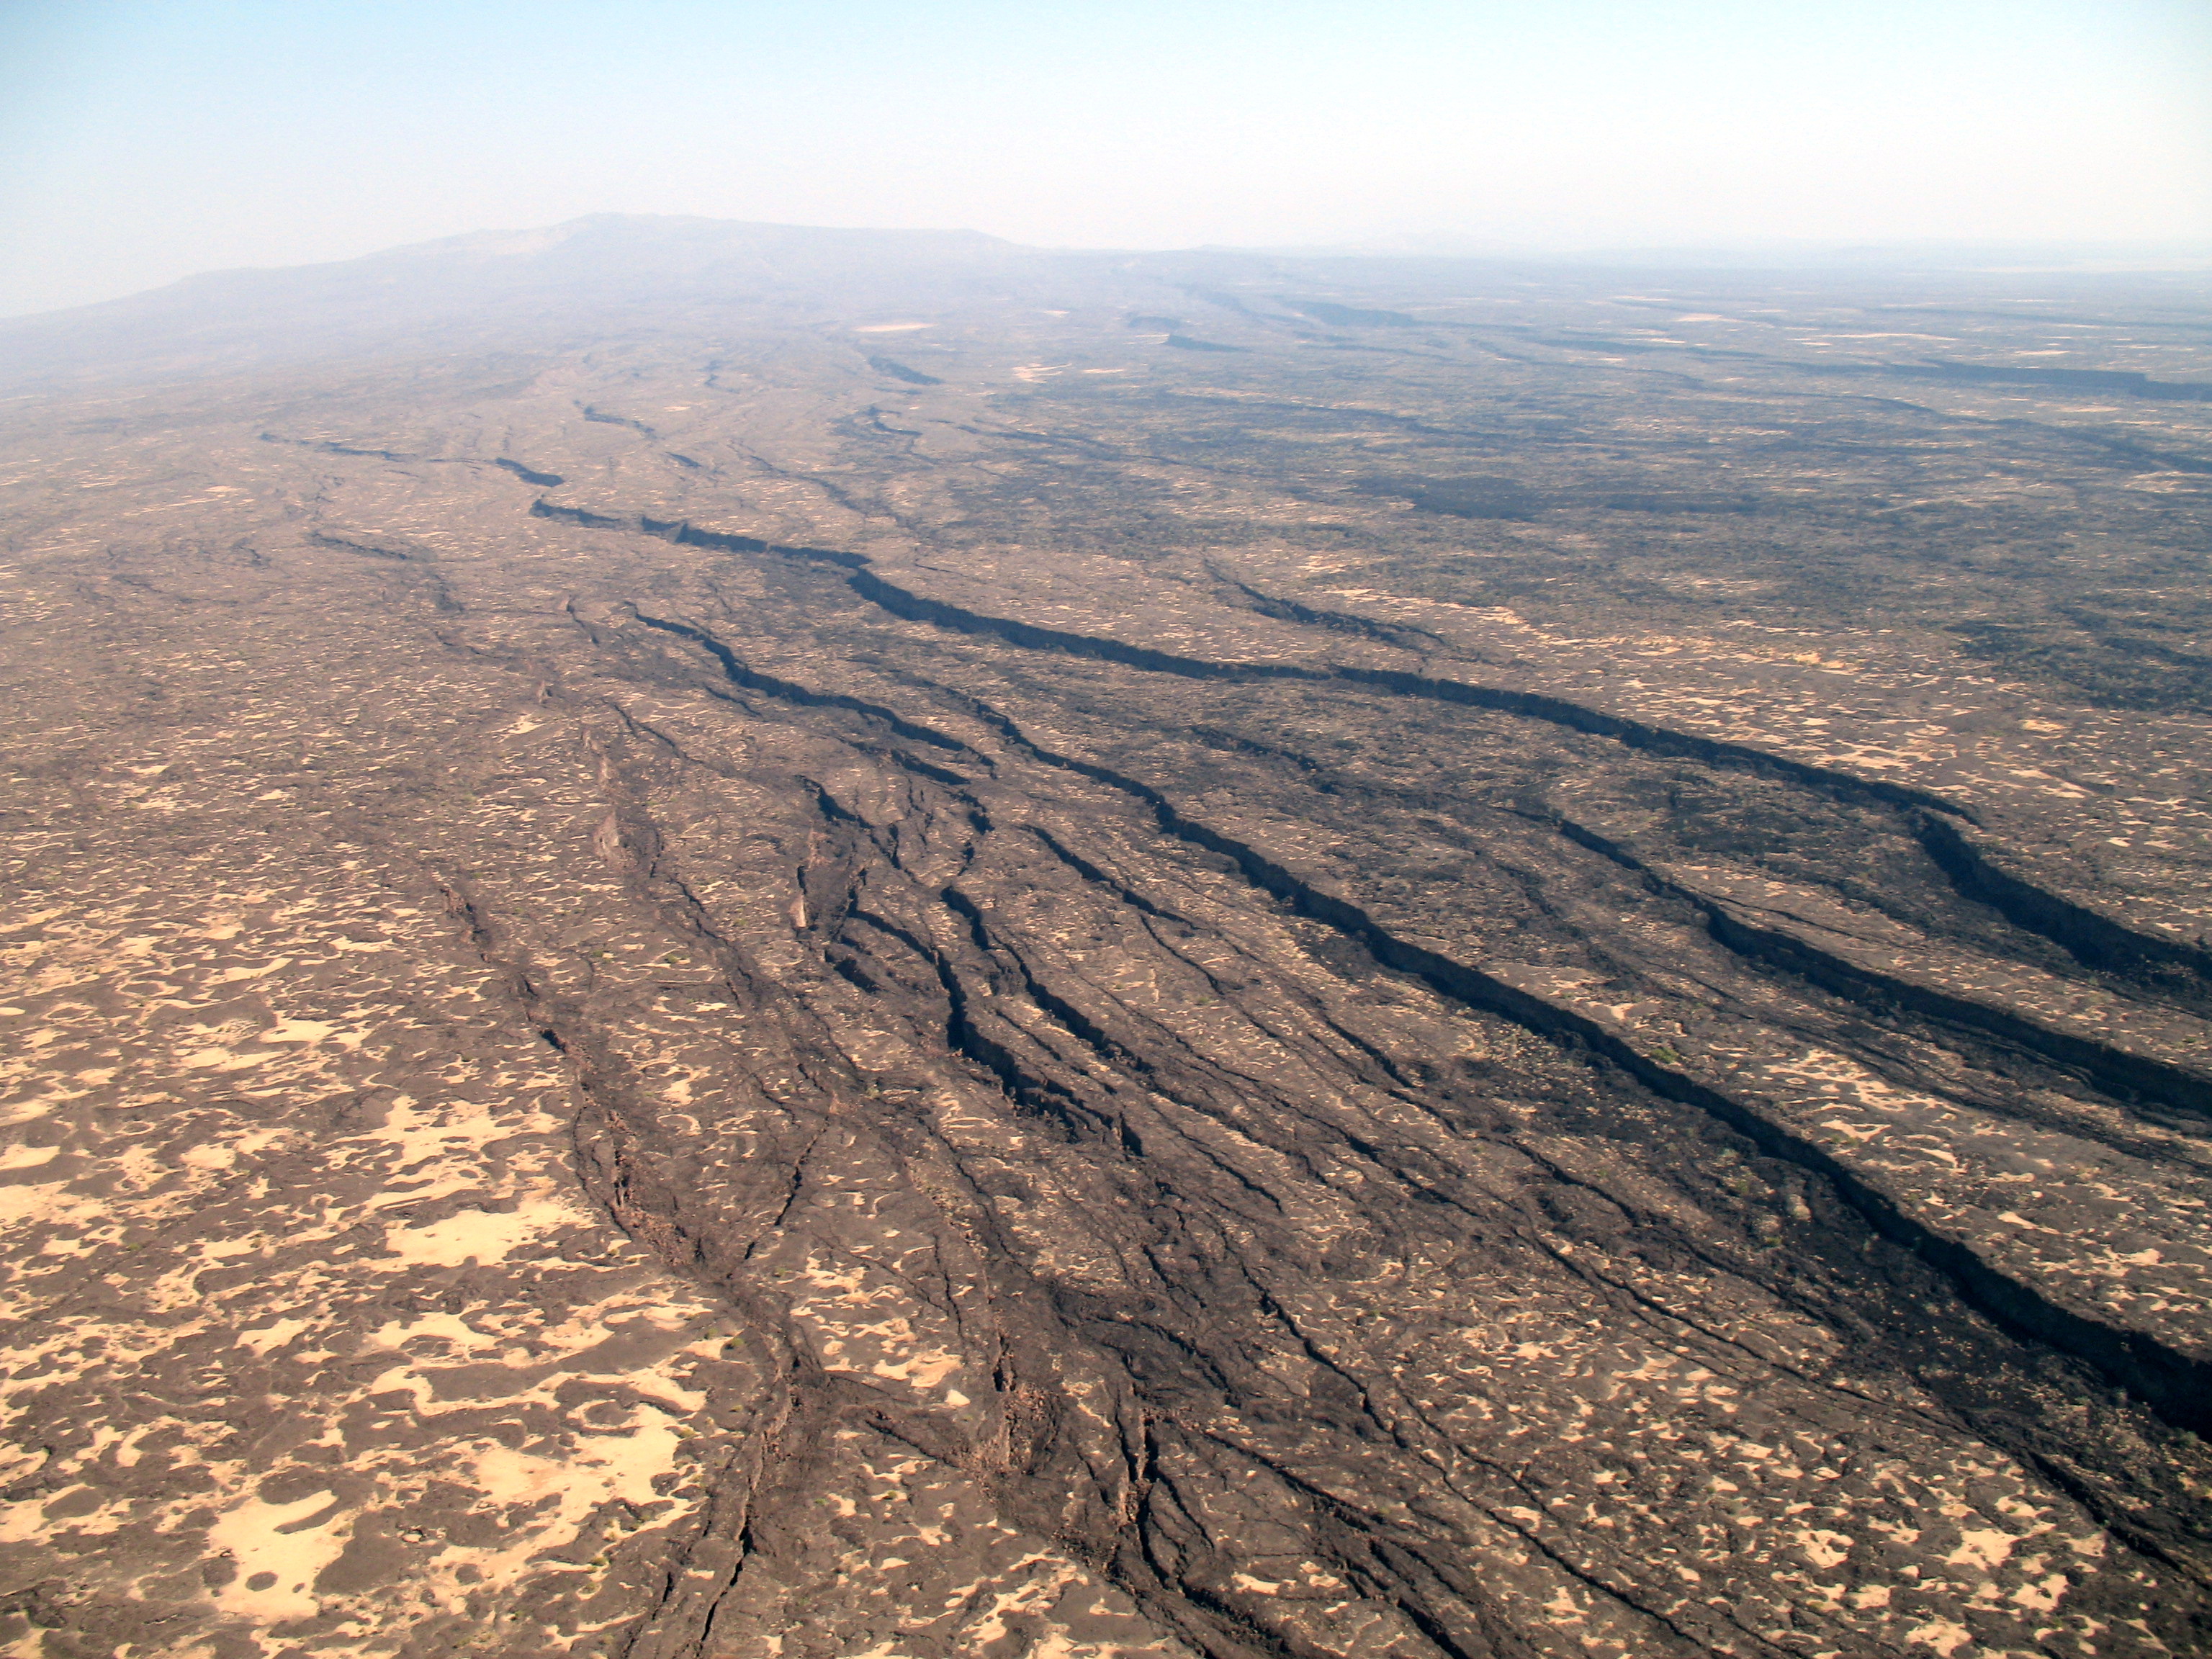
Figure 6: Photo looking NNW from the central part of the eastern flank of the Dabbahu rift segment. Dabbahu volcano is ~30 km from this site. The steep scarps were formed by many episodes of slip along dipping fault planes; some faults show > 3 m of movement in the September-October episode (Figure 10). The faults displace basaltic lavas (dark rocks) and small pockets of windblown ash and dust (white rocks). Photo by Cindy Ebinger, University of Rochester, New York.
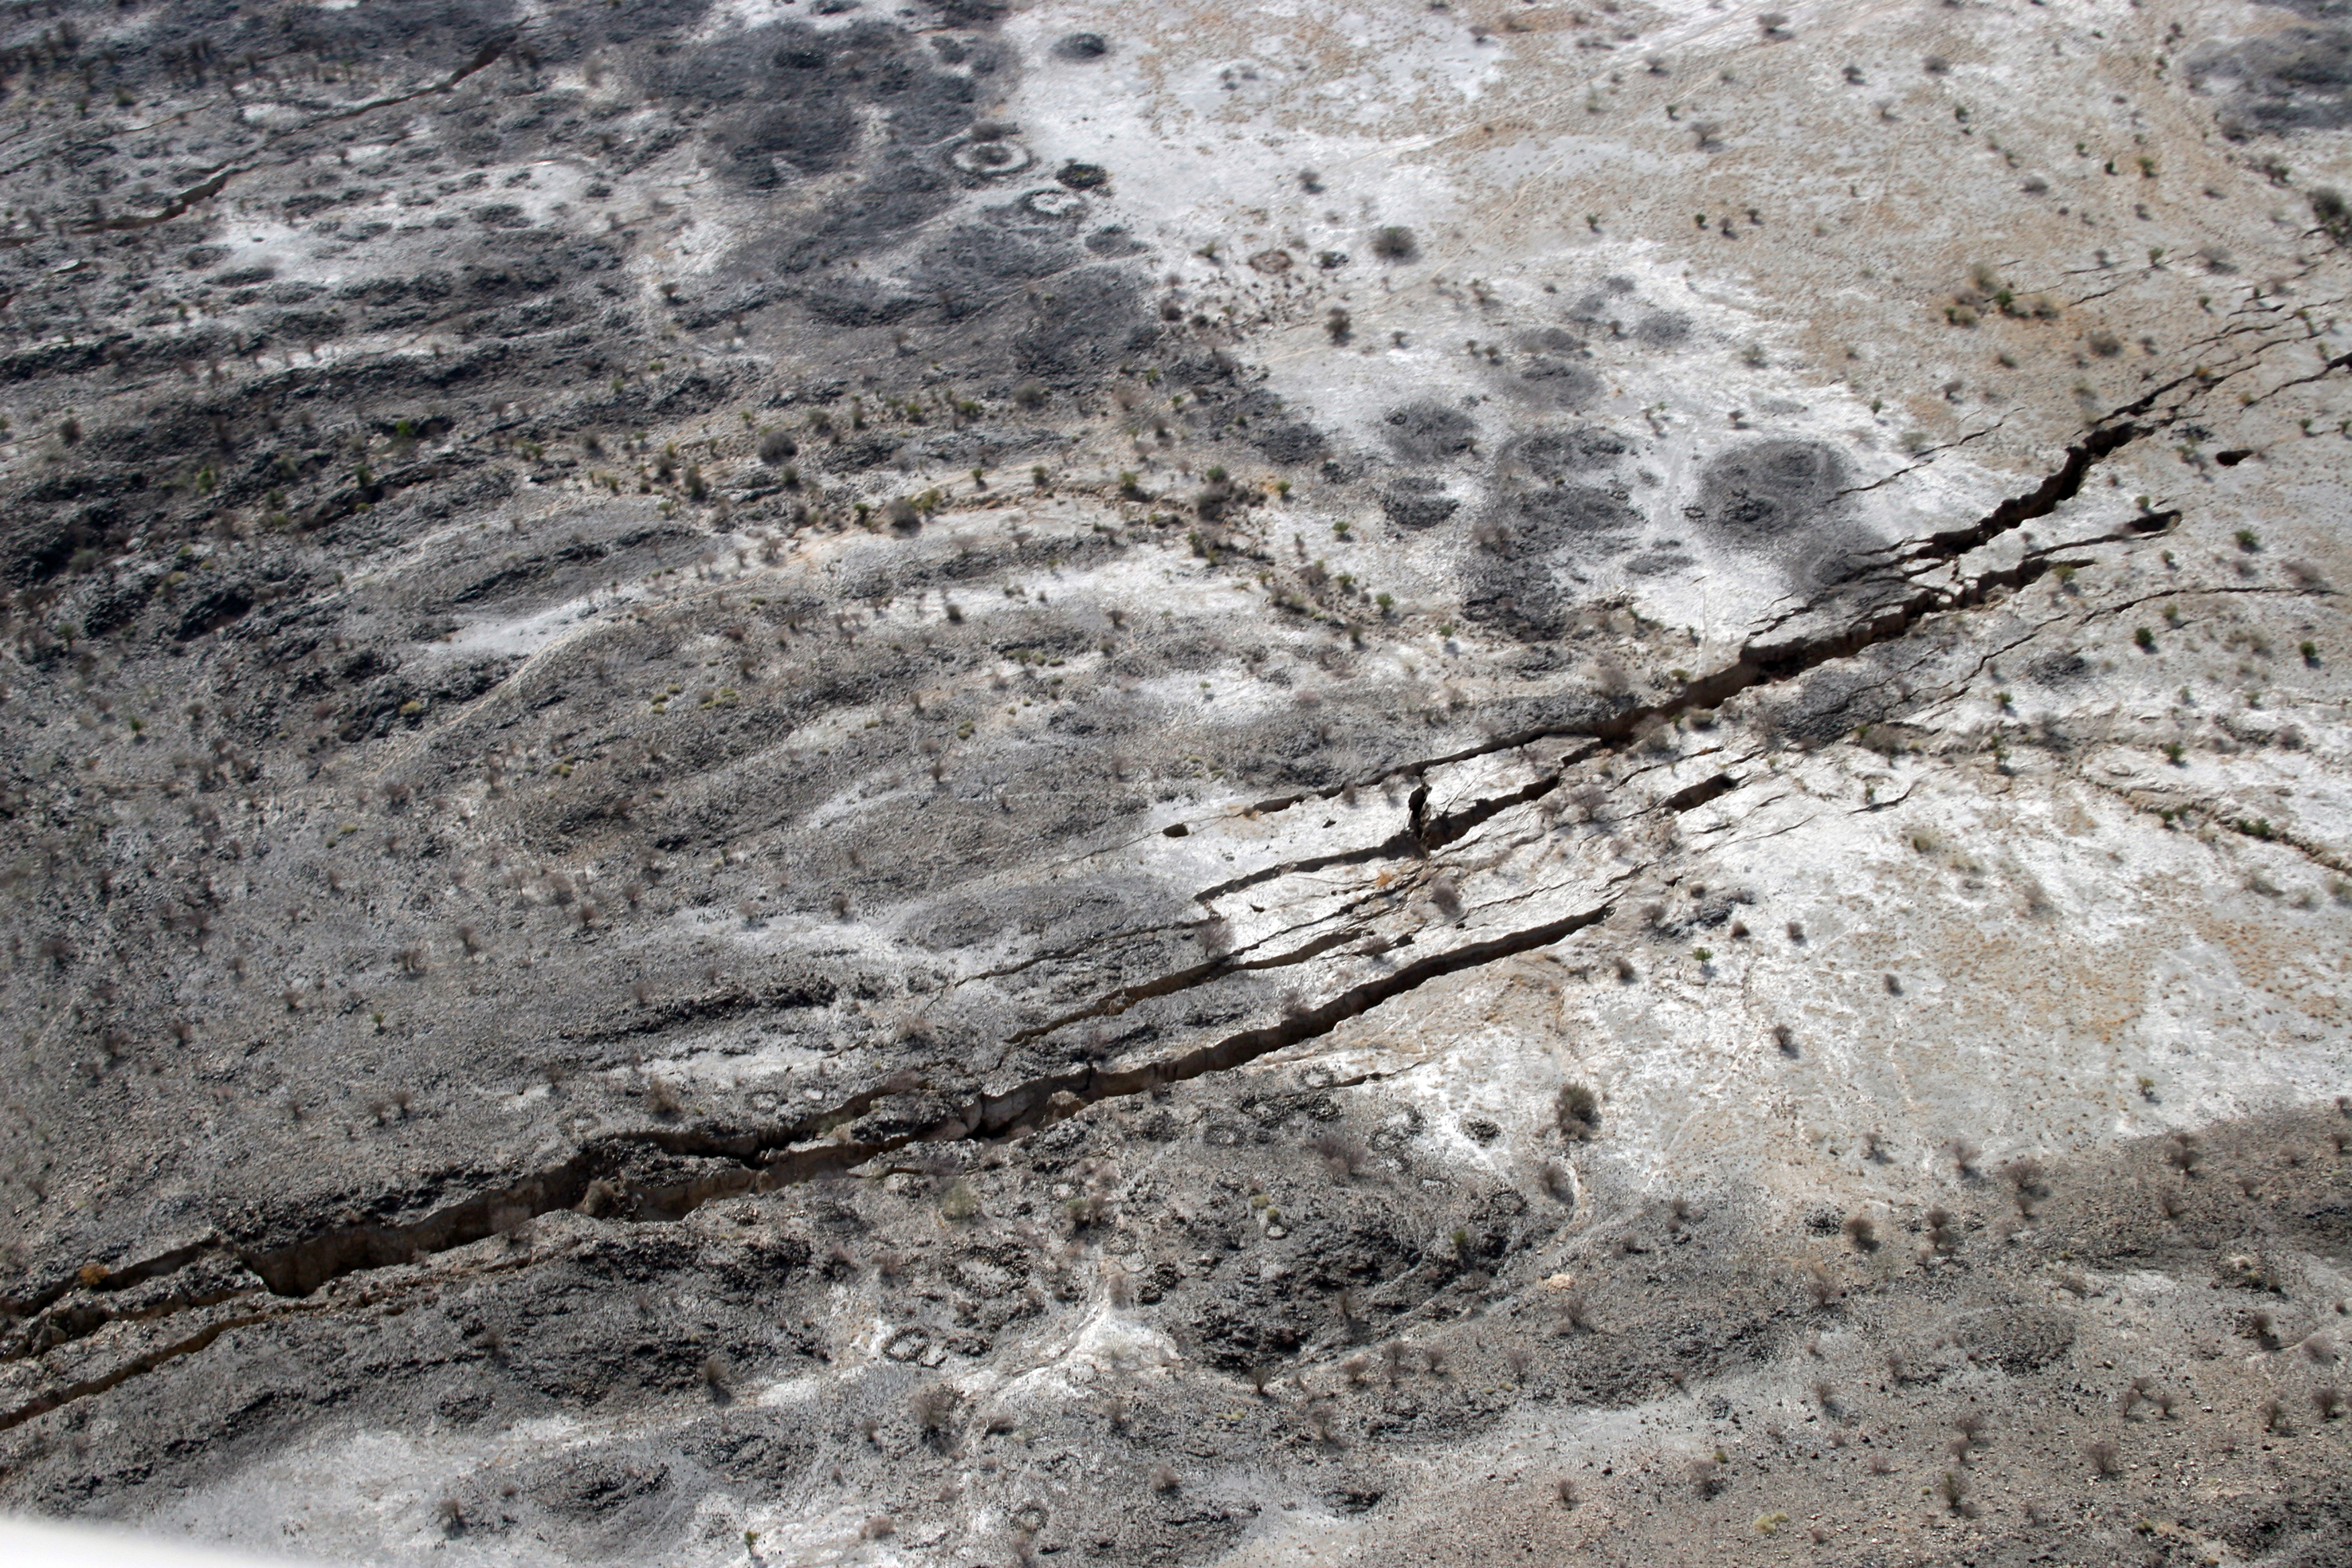
Figure 7: Aerial photo of 0.5 m-wide cracks and faults that formed in September, 2005. These cracks formed above the zone where molten rock rose into the plate, reaching to within approximately 2 kilometres of the surface. Photo by Julie Rowland, University of Auckland.
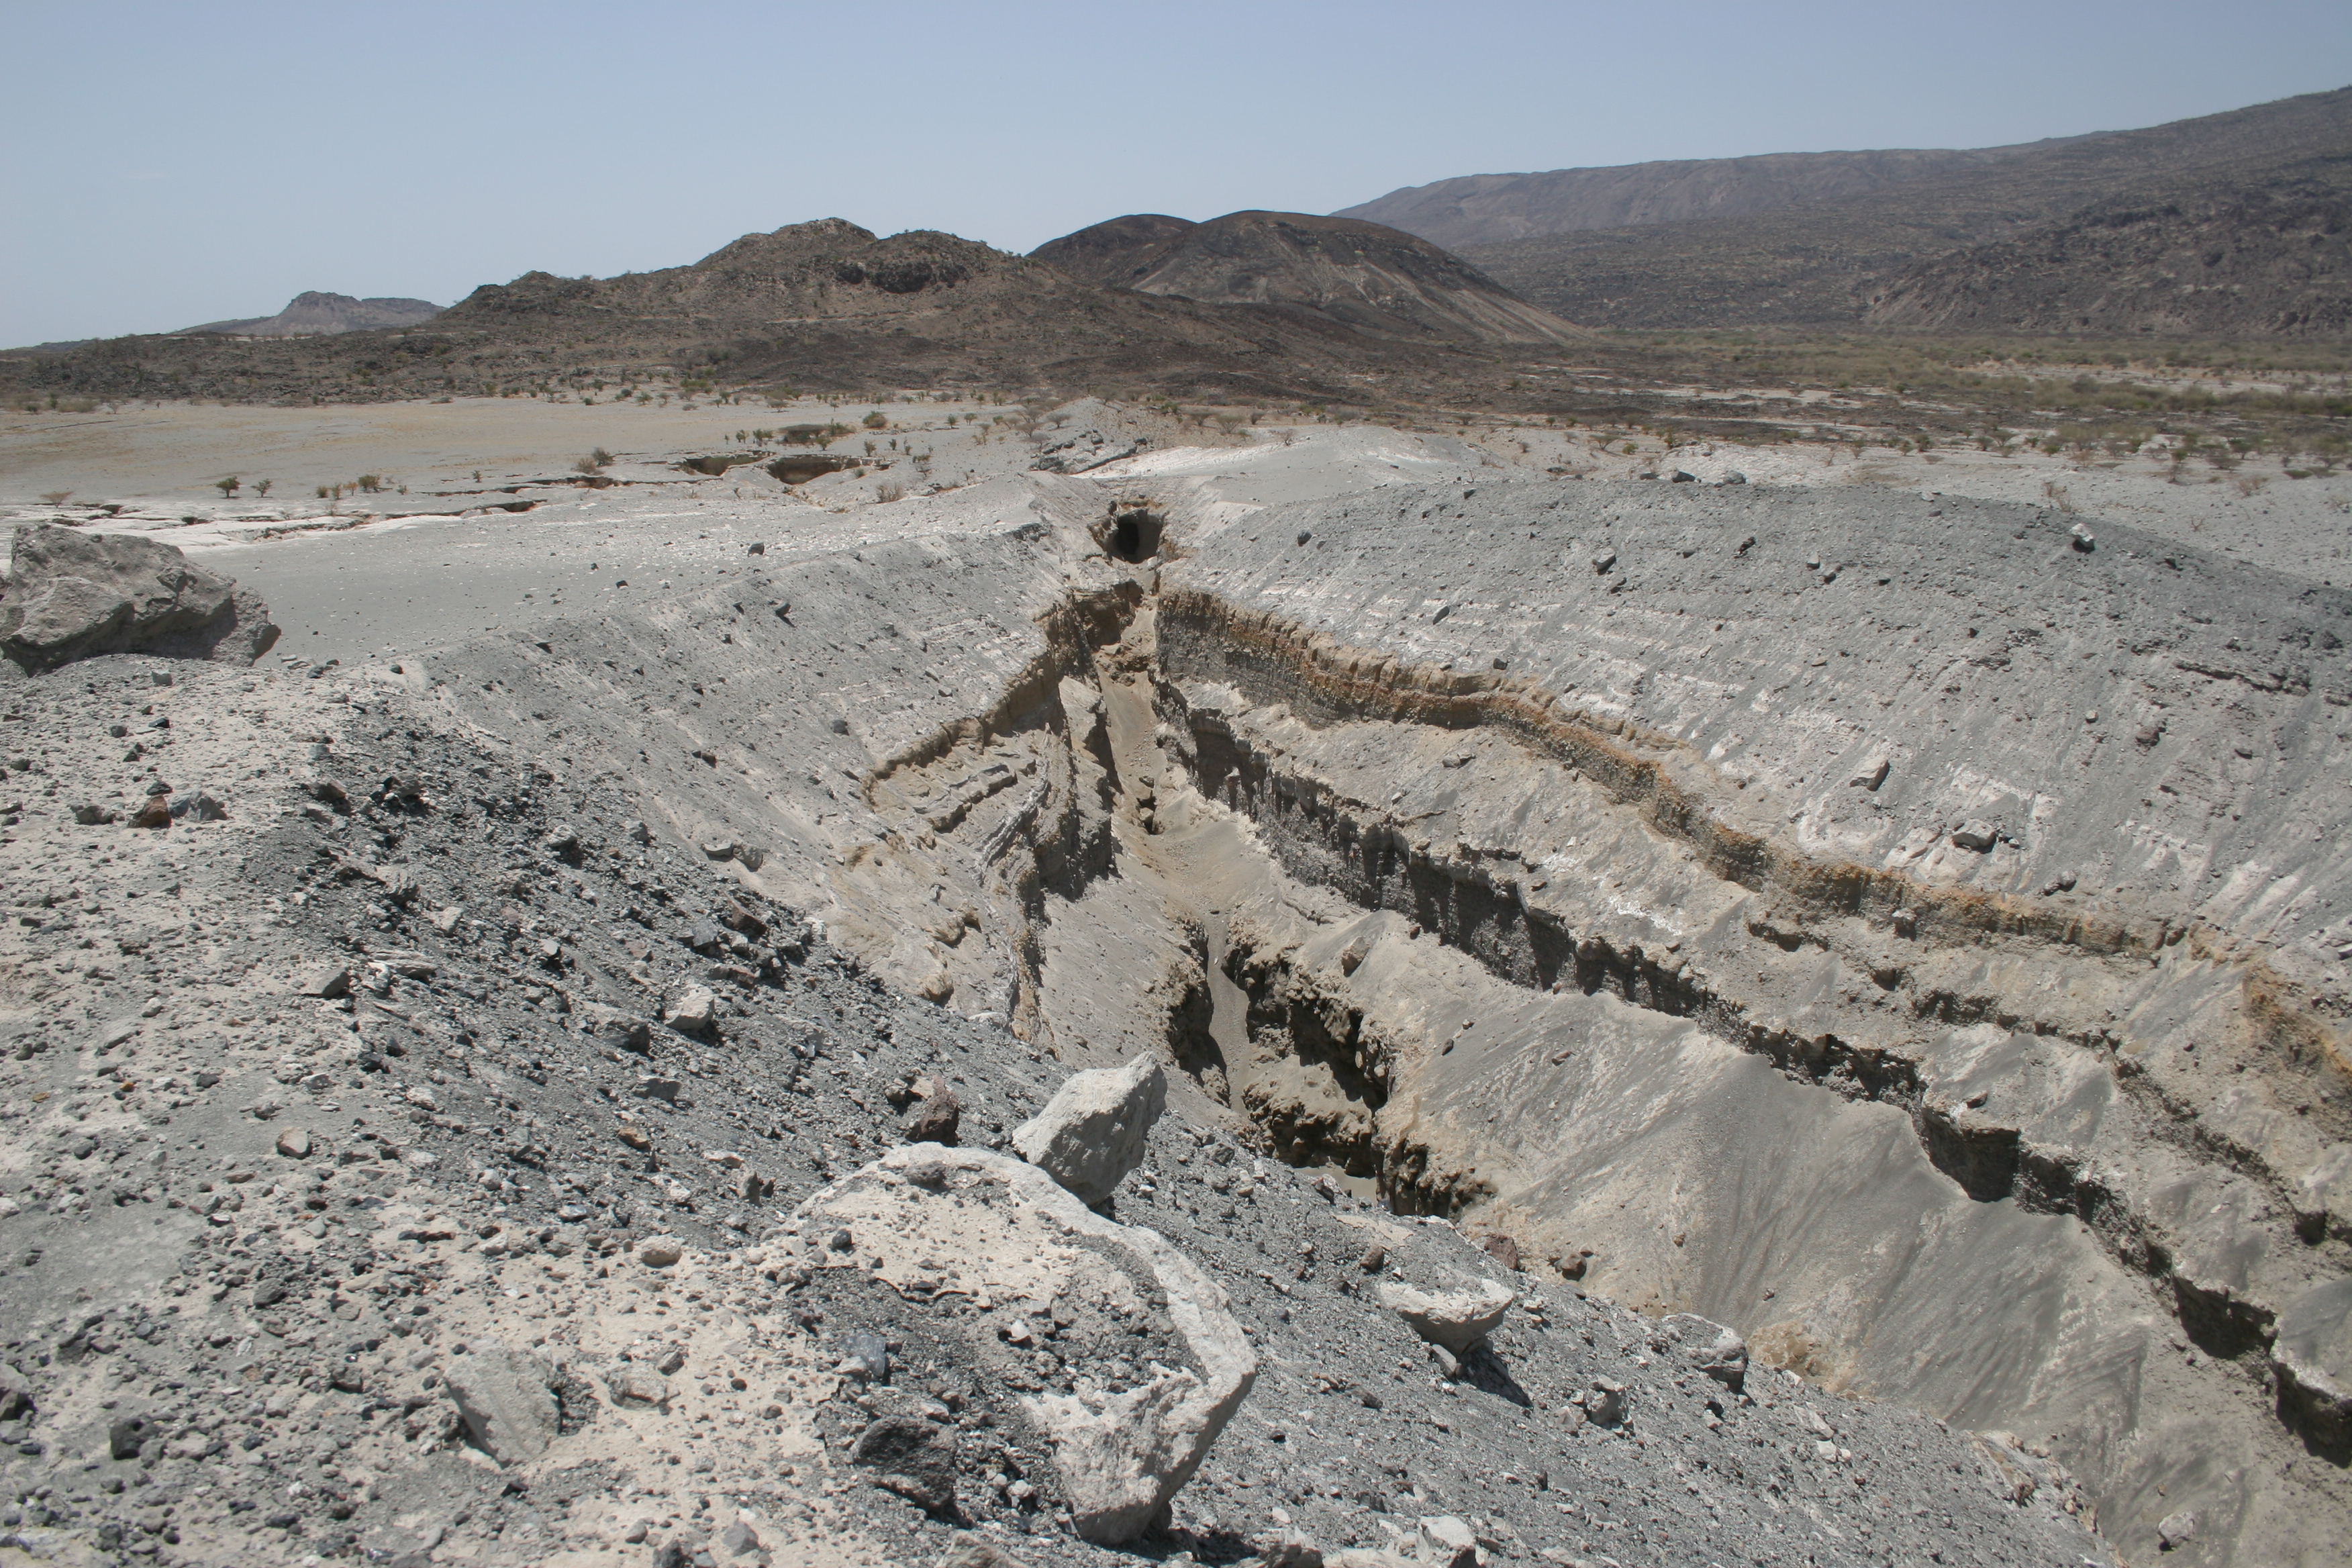
Figure 8: Volcanic vent that opened September 26, 2006. The vent was about 500 m long. View to the south from the north end of the vent - notice the tunnel at the southern end. Notice the layers of ash that built up over a periods of days around the vent. The rhyolitic rocks in the foreground were blown out of the vent. Photo by Julie Rowland, University of Auckland.
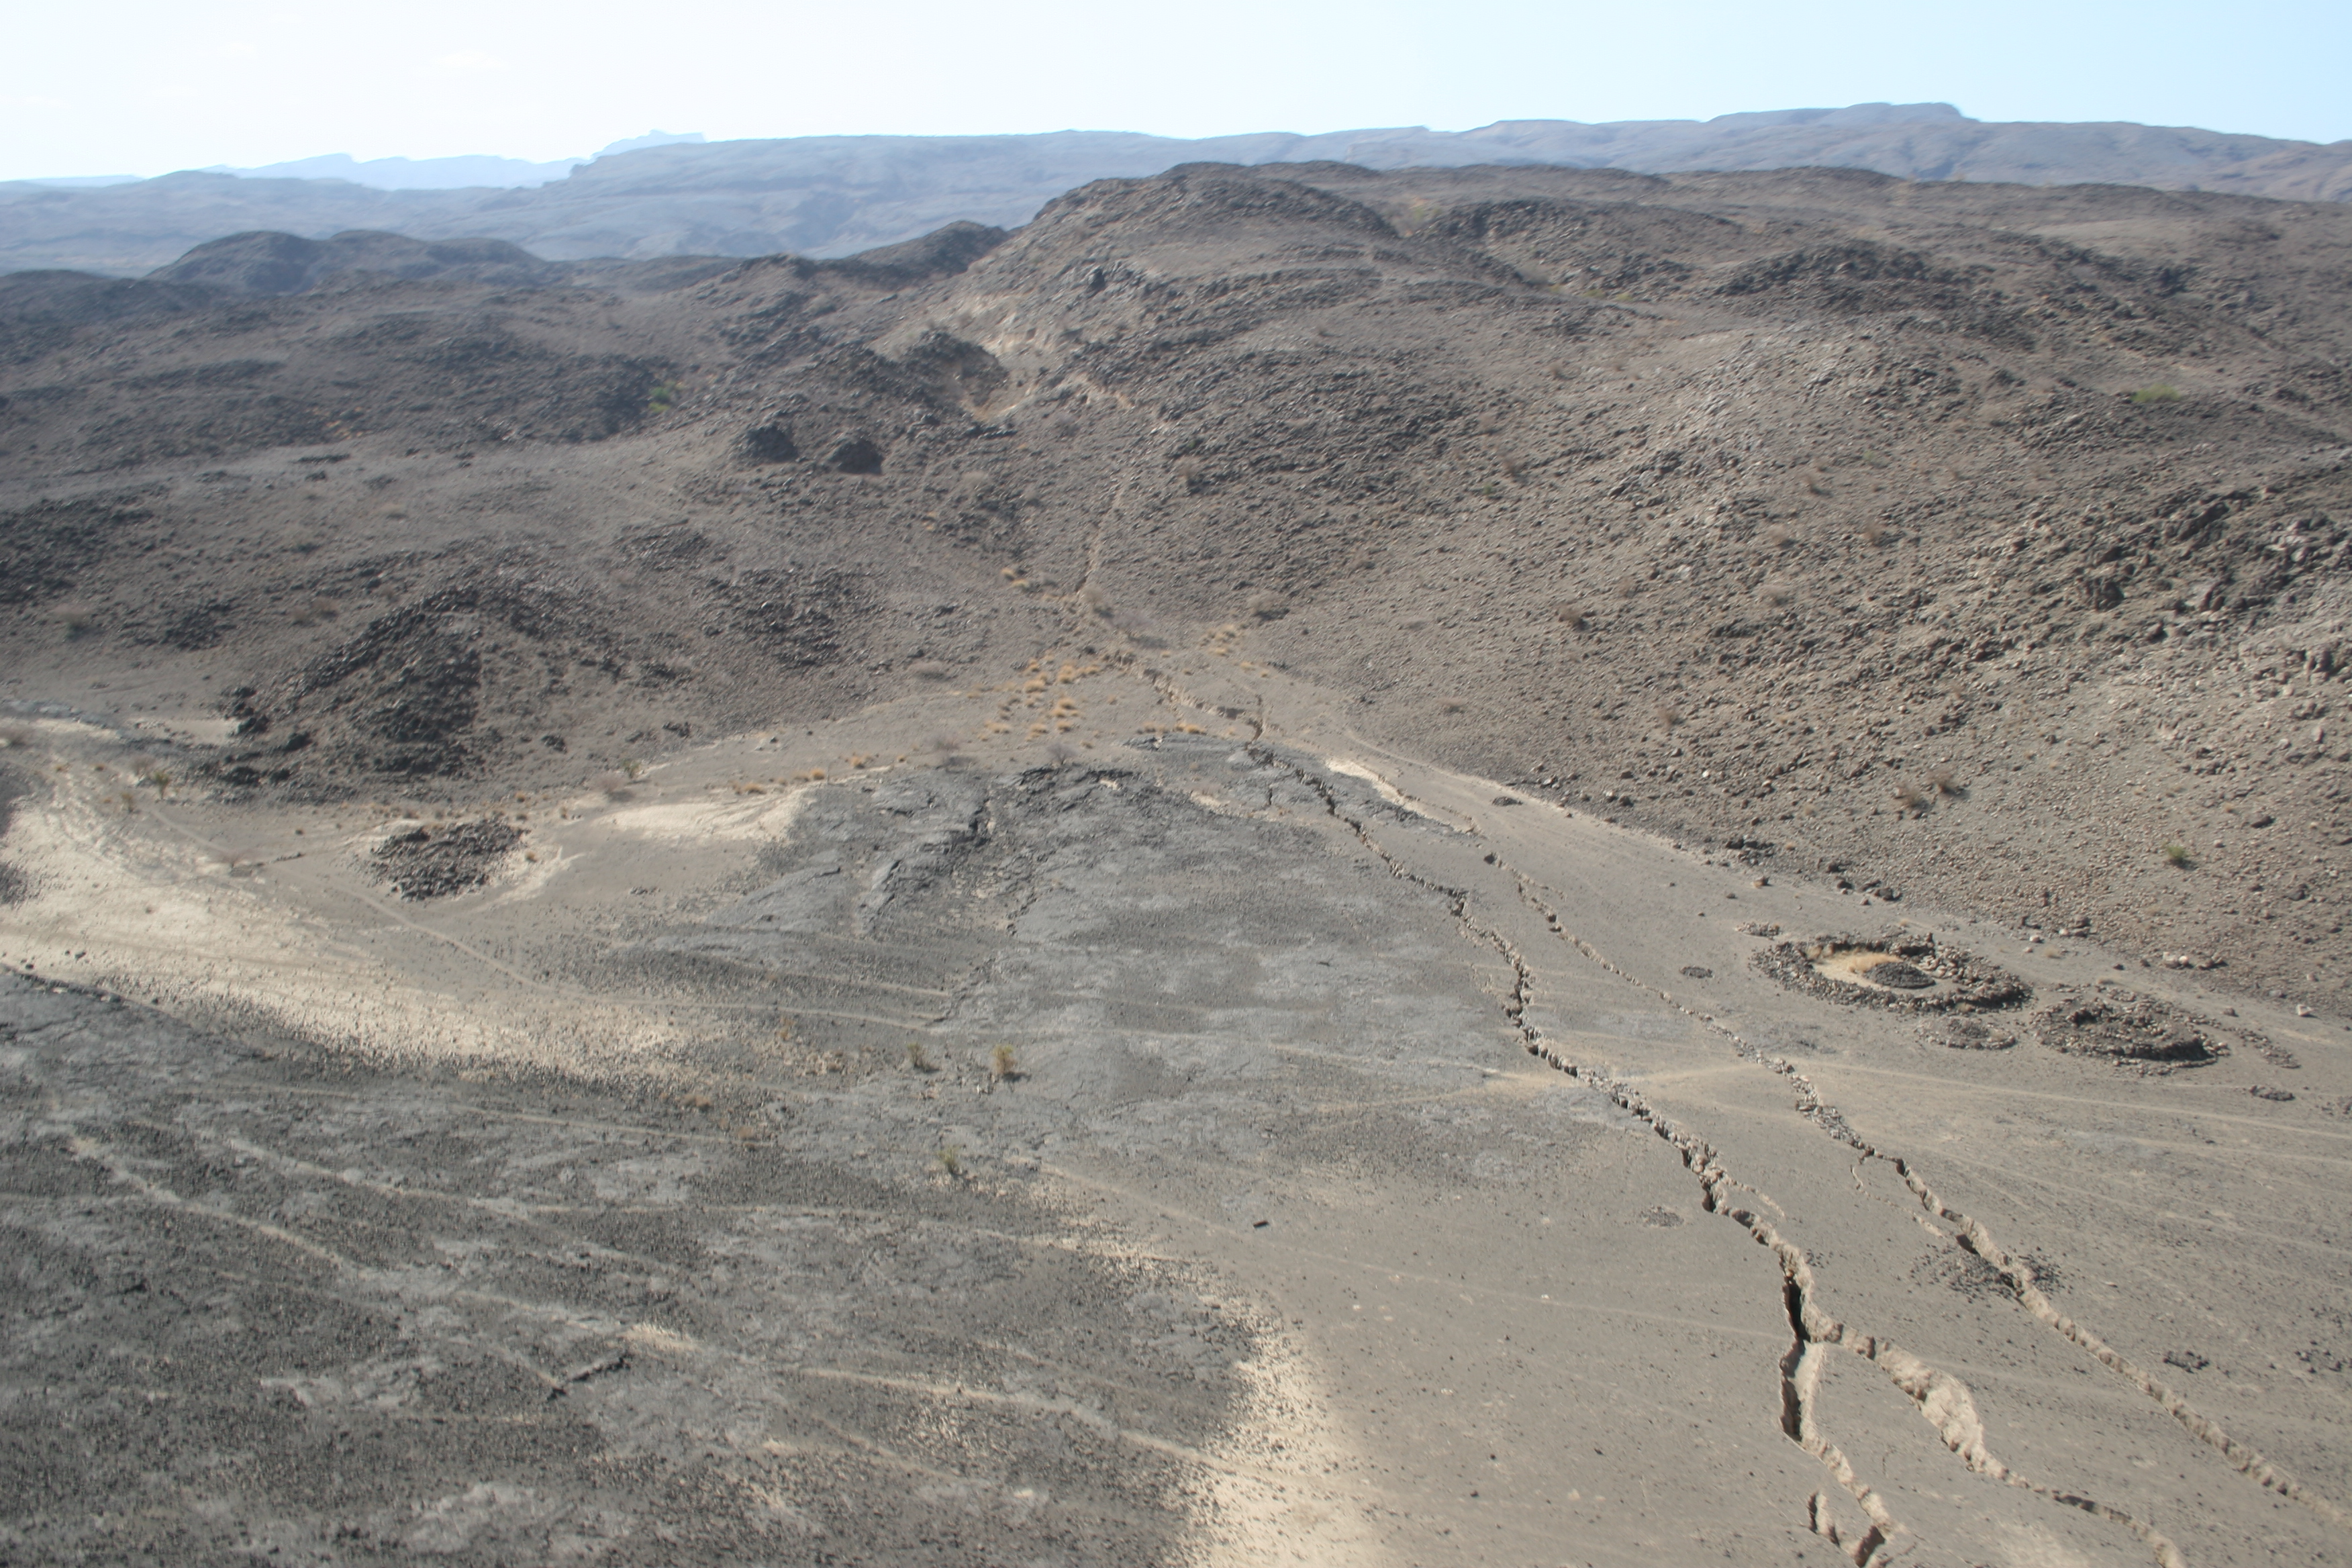
Figure 9: Central section of 60 km-long rift zone that opened south of Dabbahu volcano. NW facing fault with > 3 m offset on eastern flank ~ 30 km south of Dabbahu volcano. The cracks formed in older basalts and softer sedimentary rocks and volcanic ash. Photo by Julie Rowland, University of Auckland.
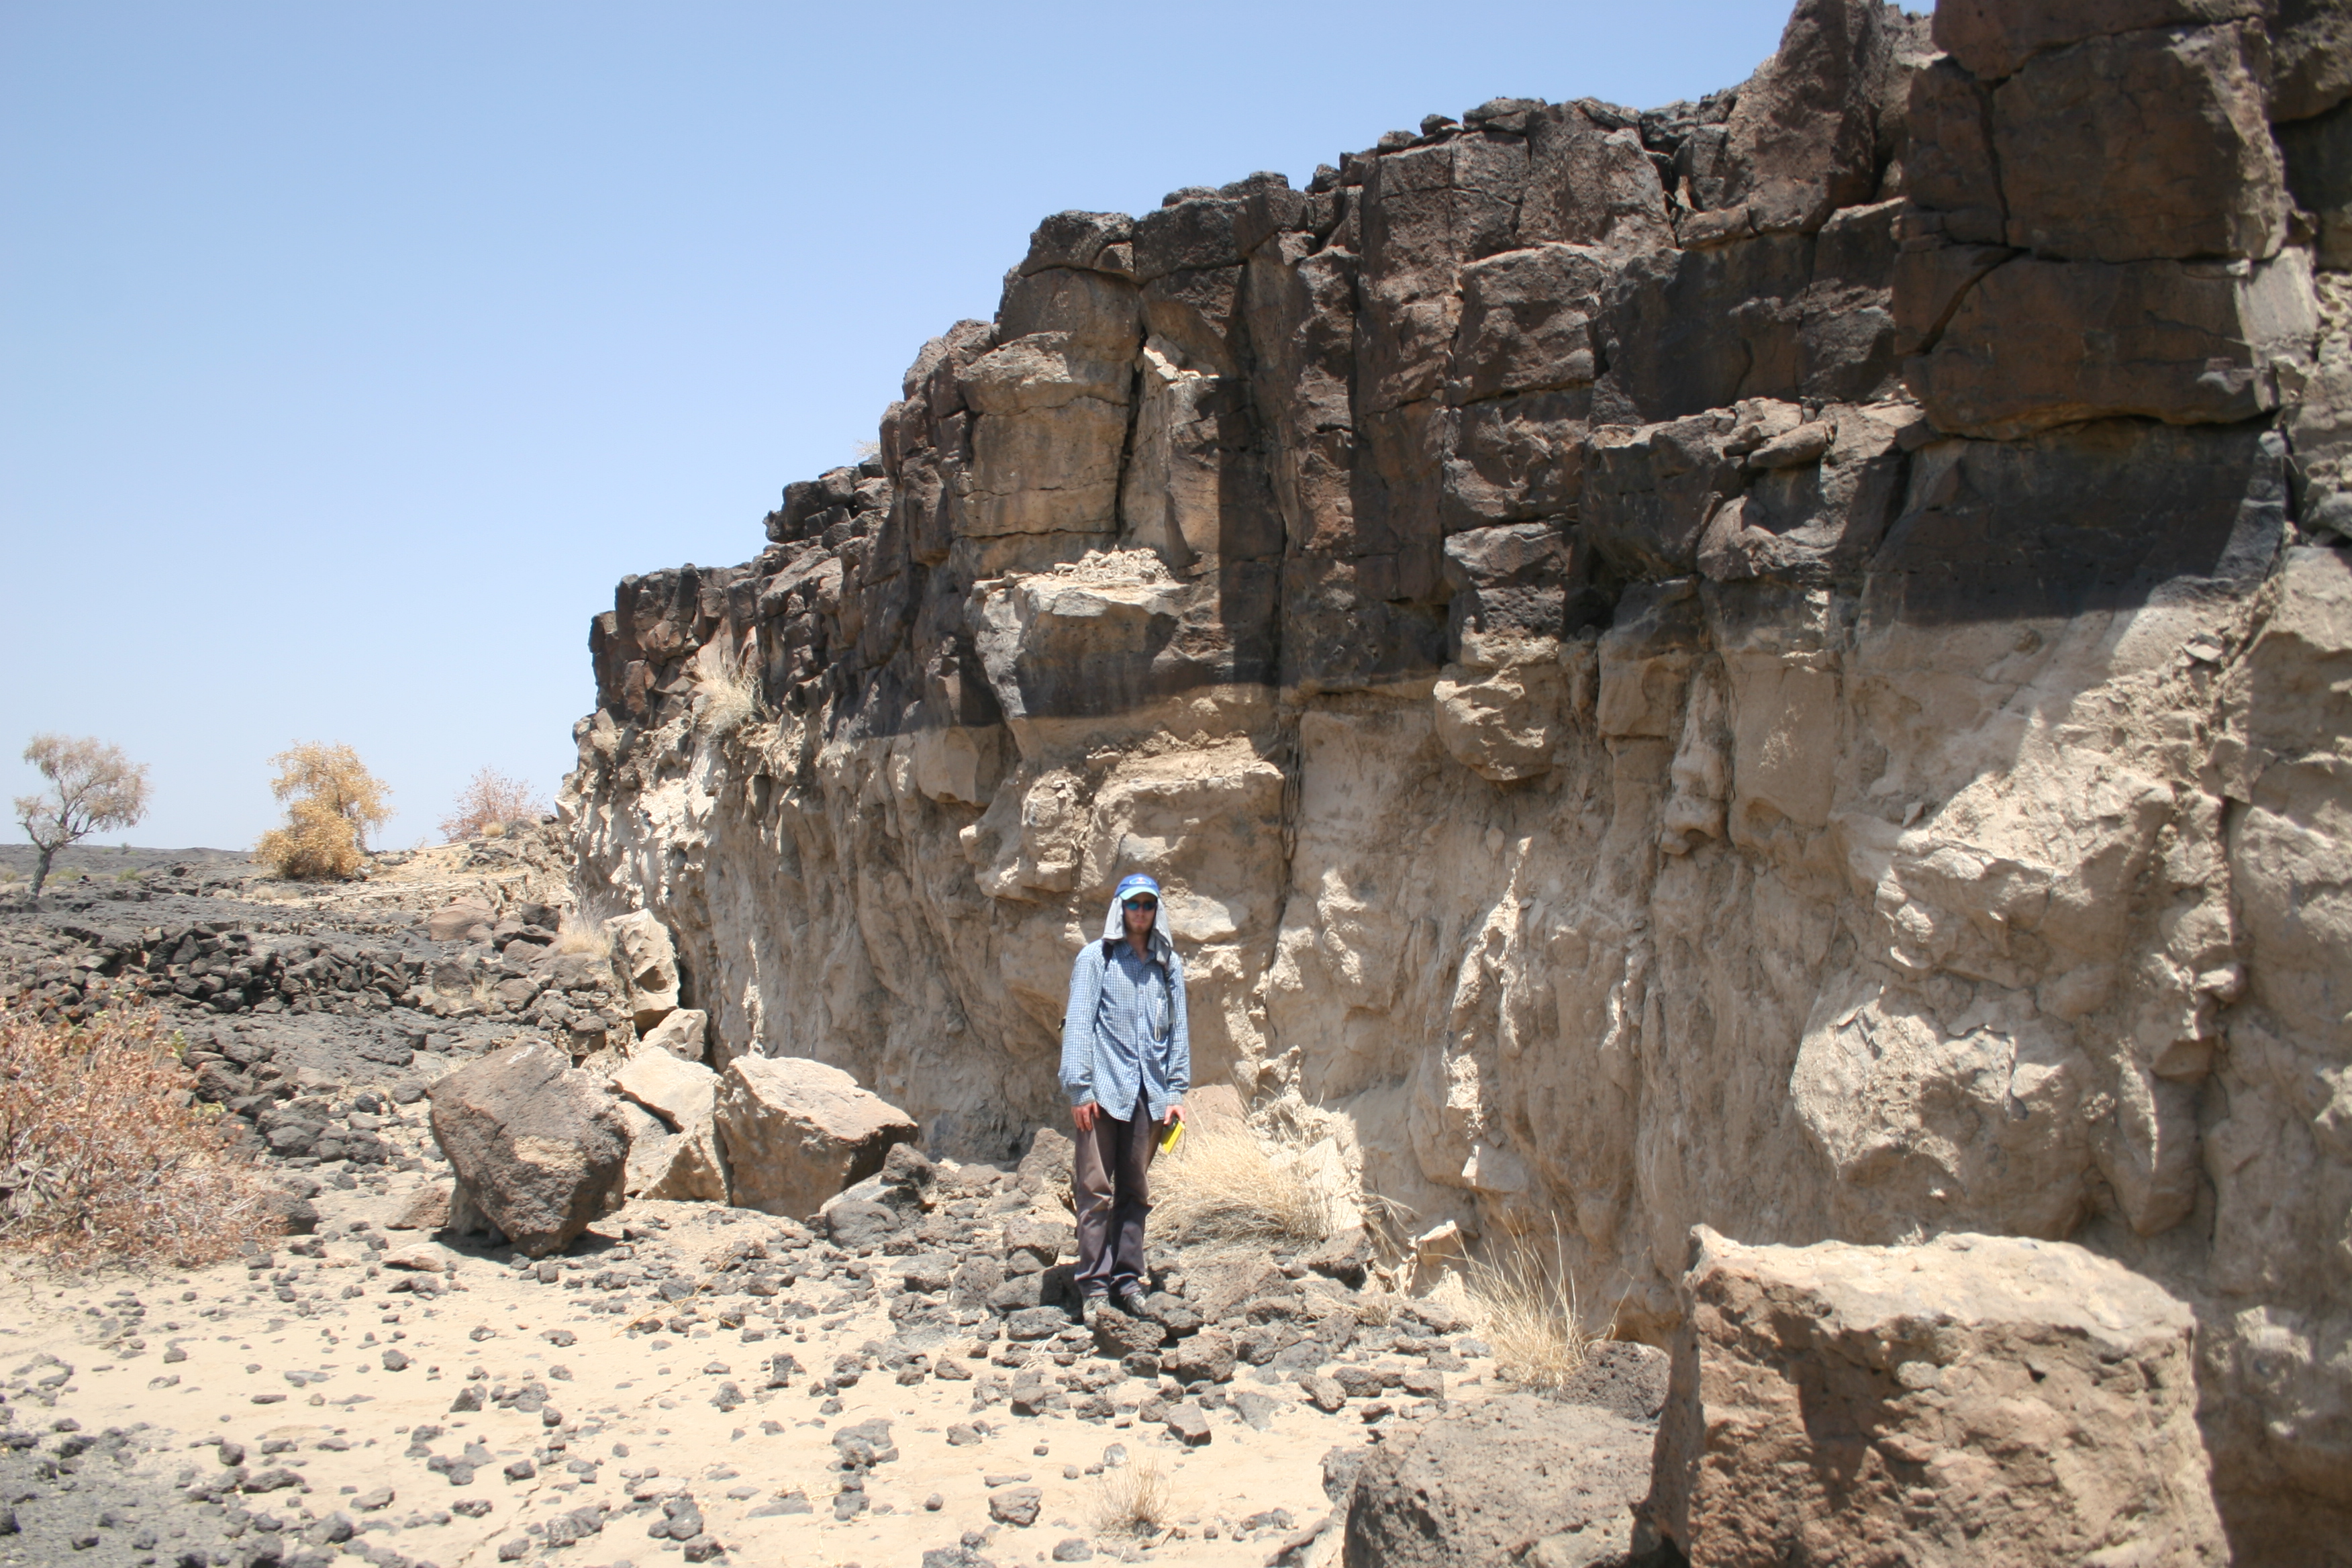
Figure 10: Royal Holloway PhD student Derek Keir measuring slip along an active normal fault near the central segment. The buff-coloured region shows the 2005 fault slip. Photo by Julie Rowland, University of Auckland.
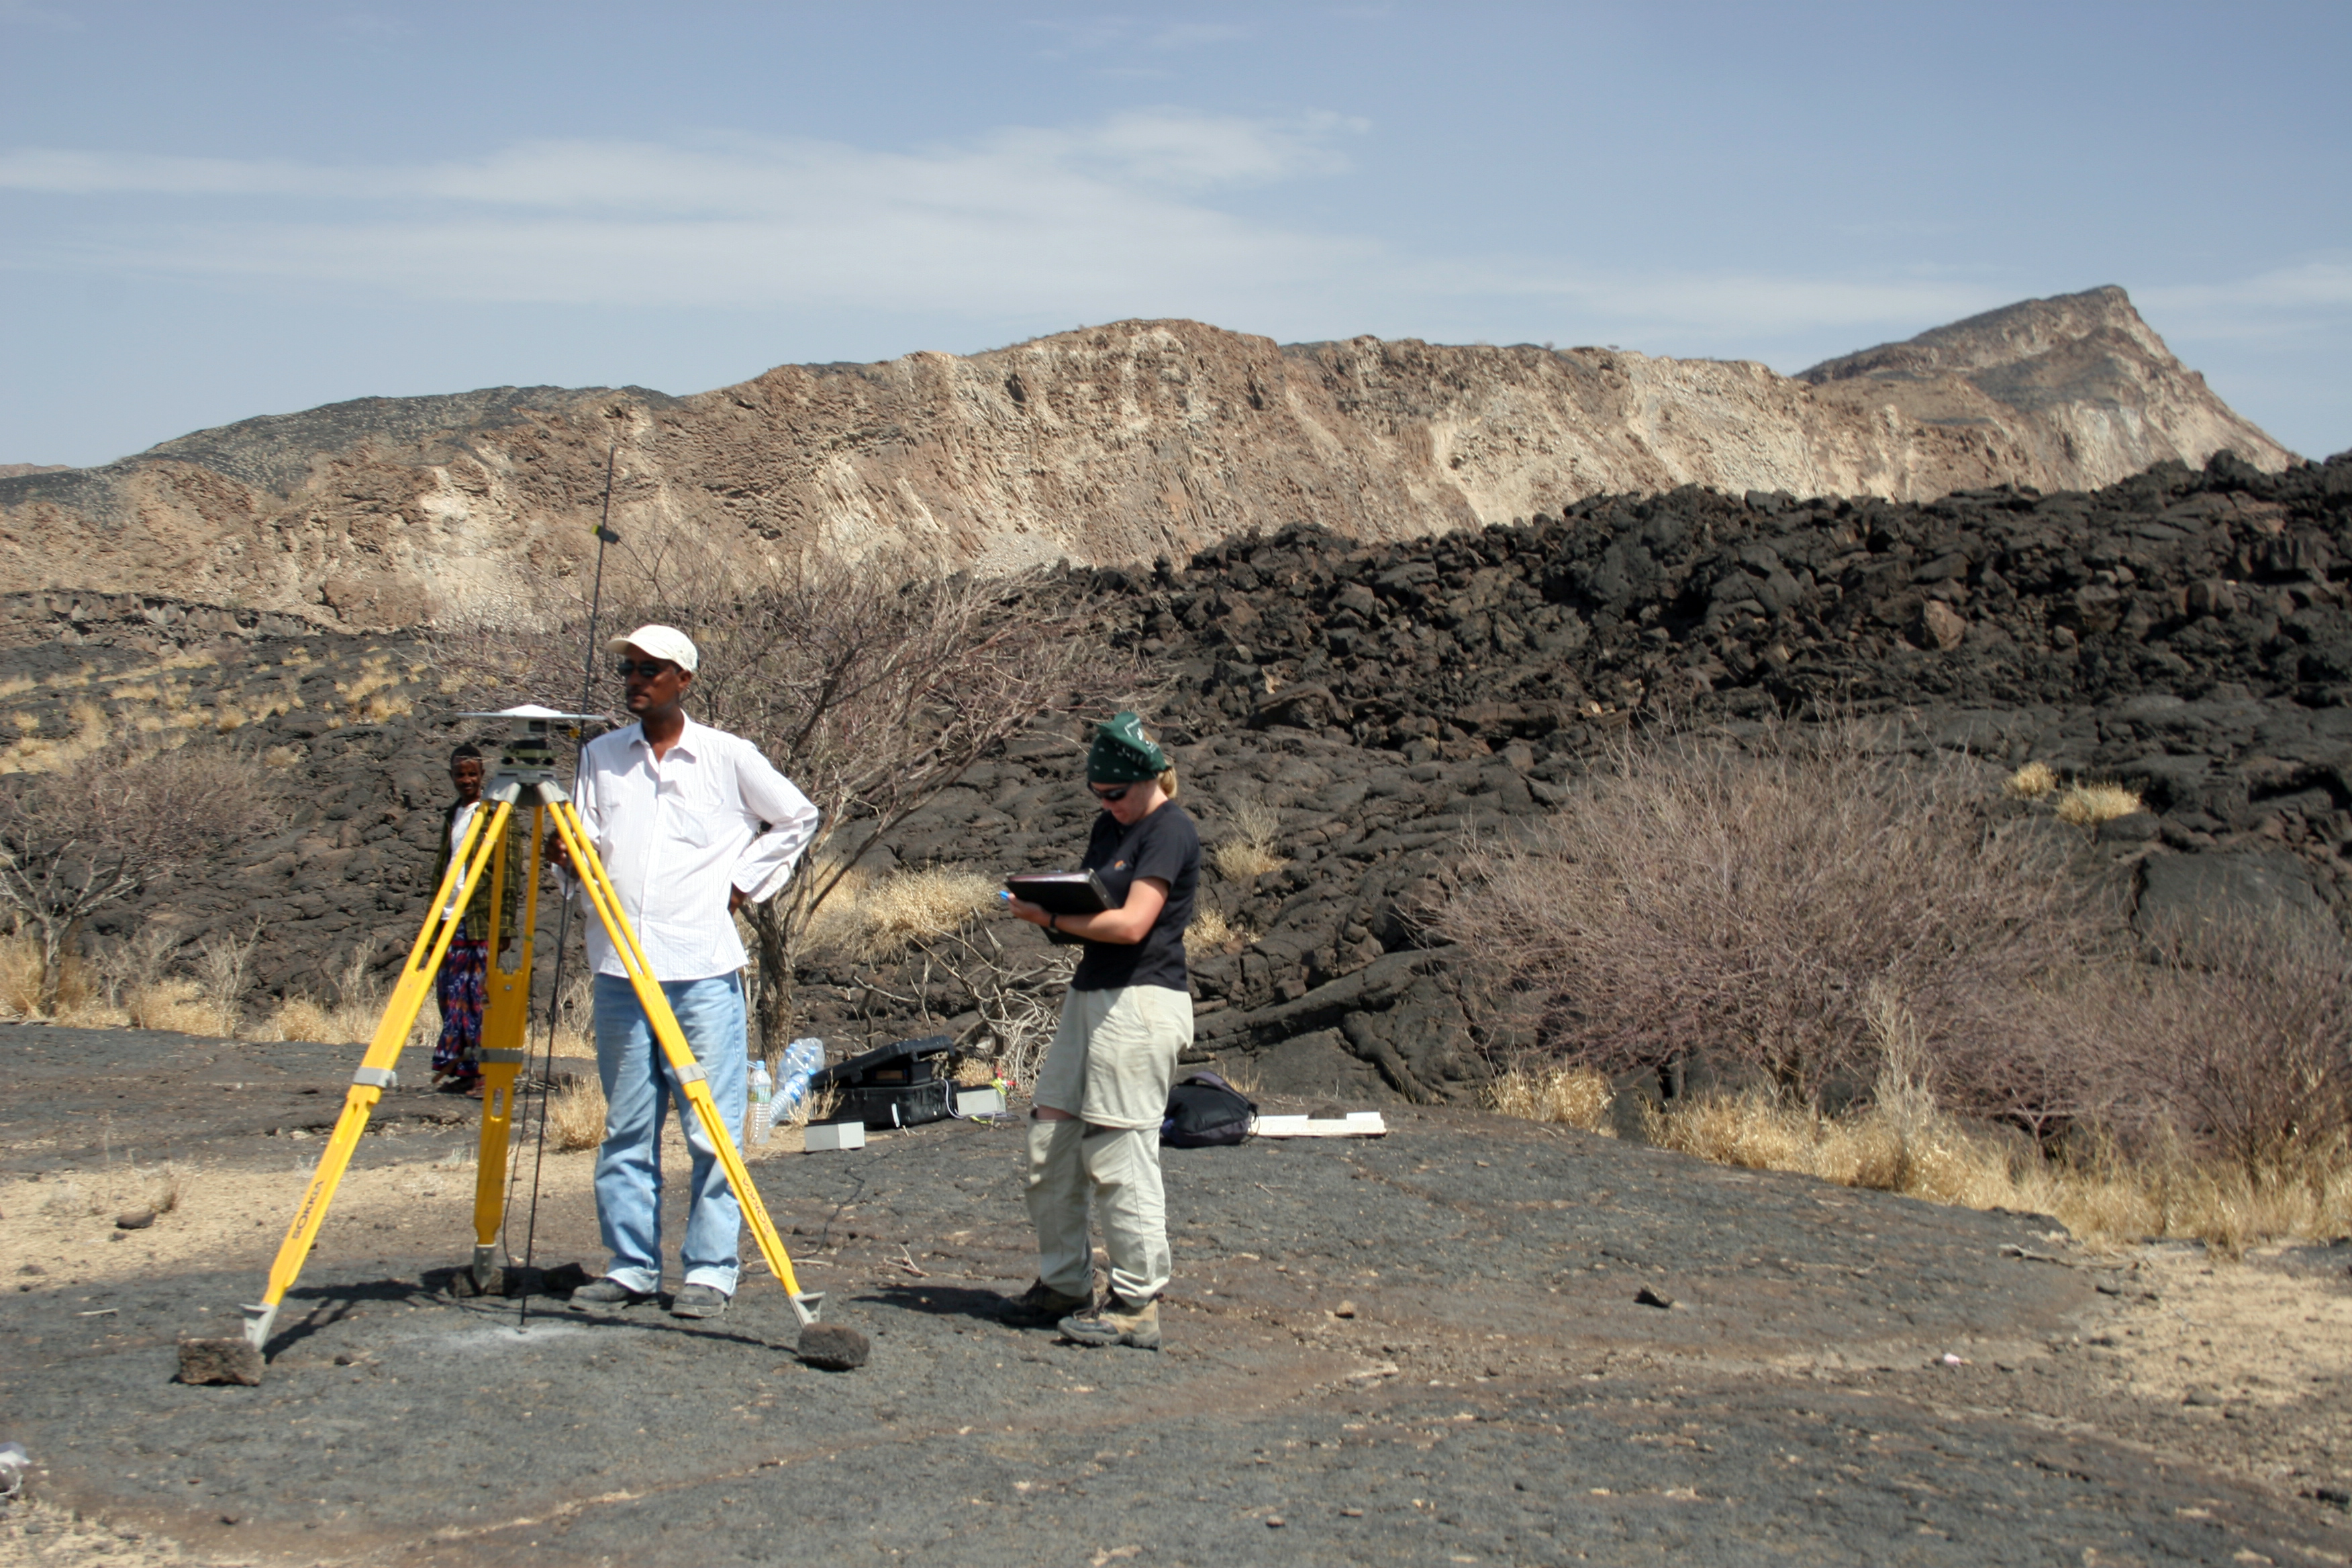
Figure 11: Oxford University PhD student Juliet Biggs and Ethiopian Mapping Agency surveyor Feleke Worku making a GPS measurement at a site between lava flows at the centre of the Dabbahu rift. The Scarp in background is a faulted volcano. Daytime temperatures were over 40C during the March visit. Photo by Julie Rowland, Auckland University.
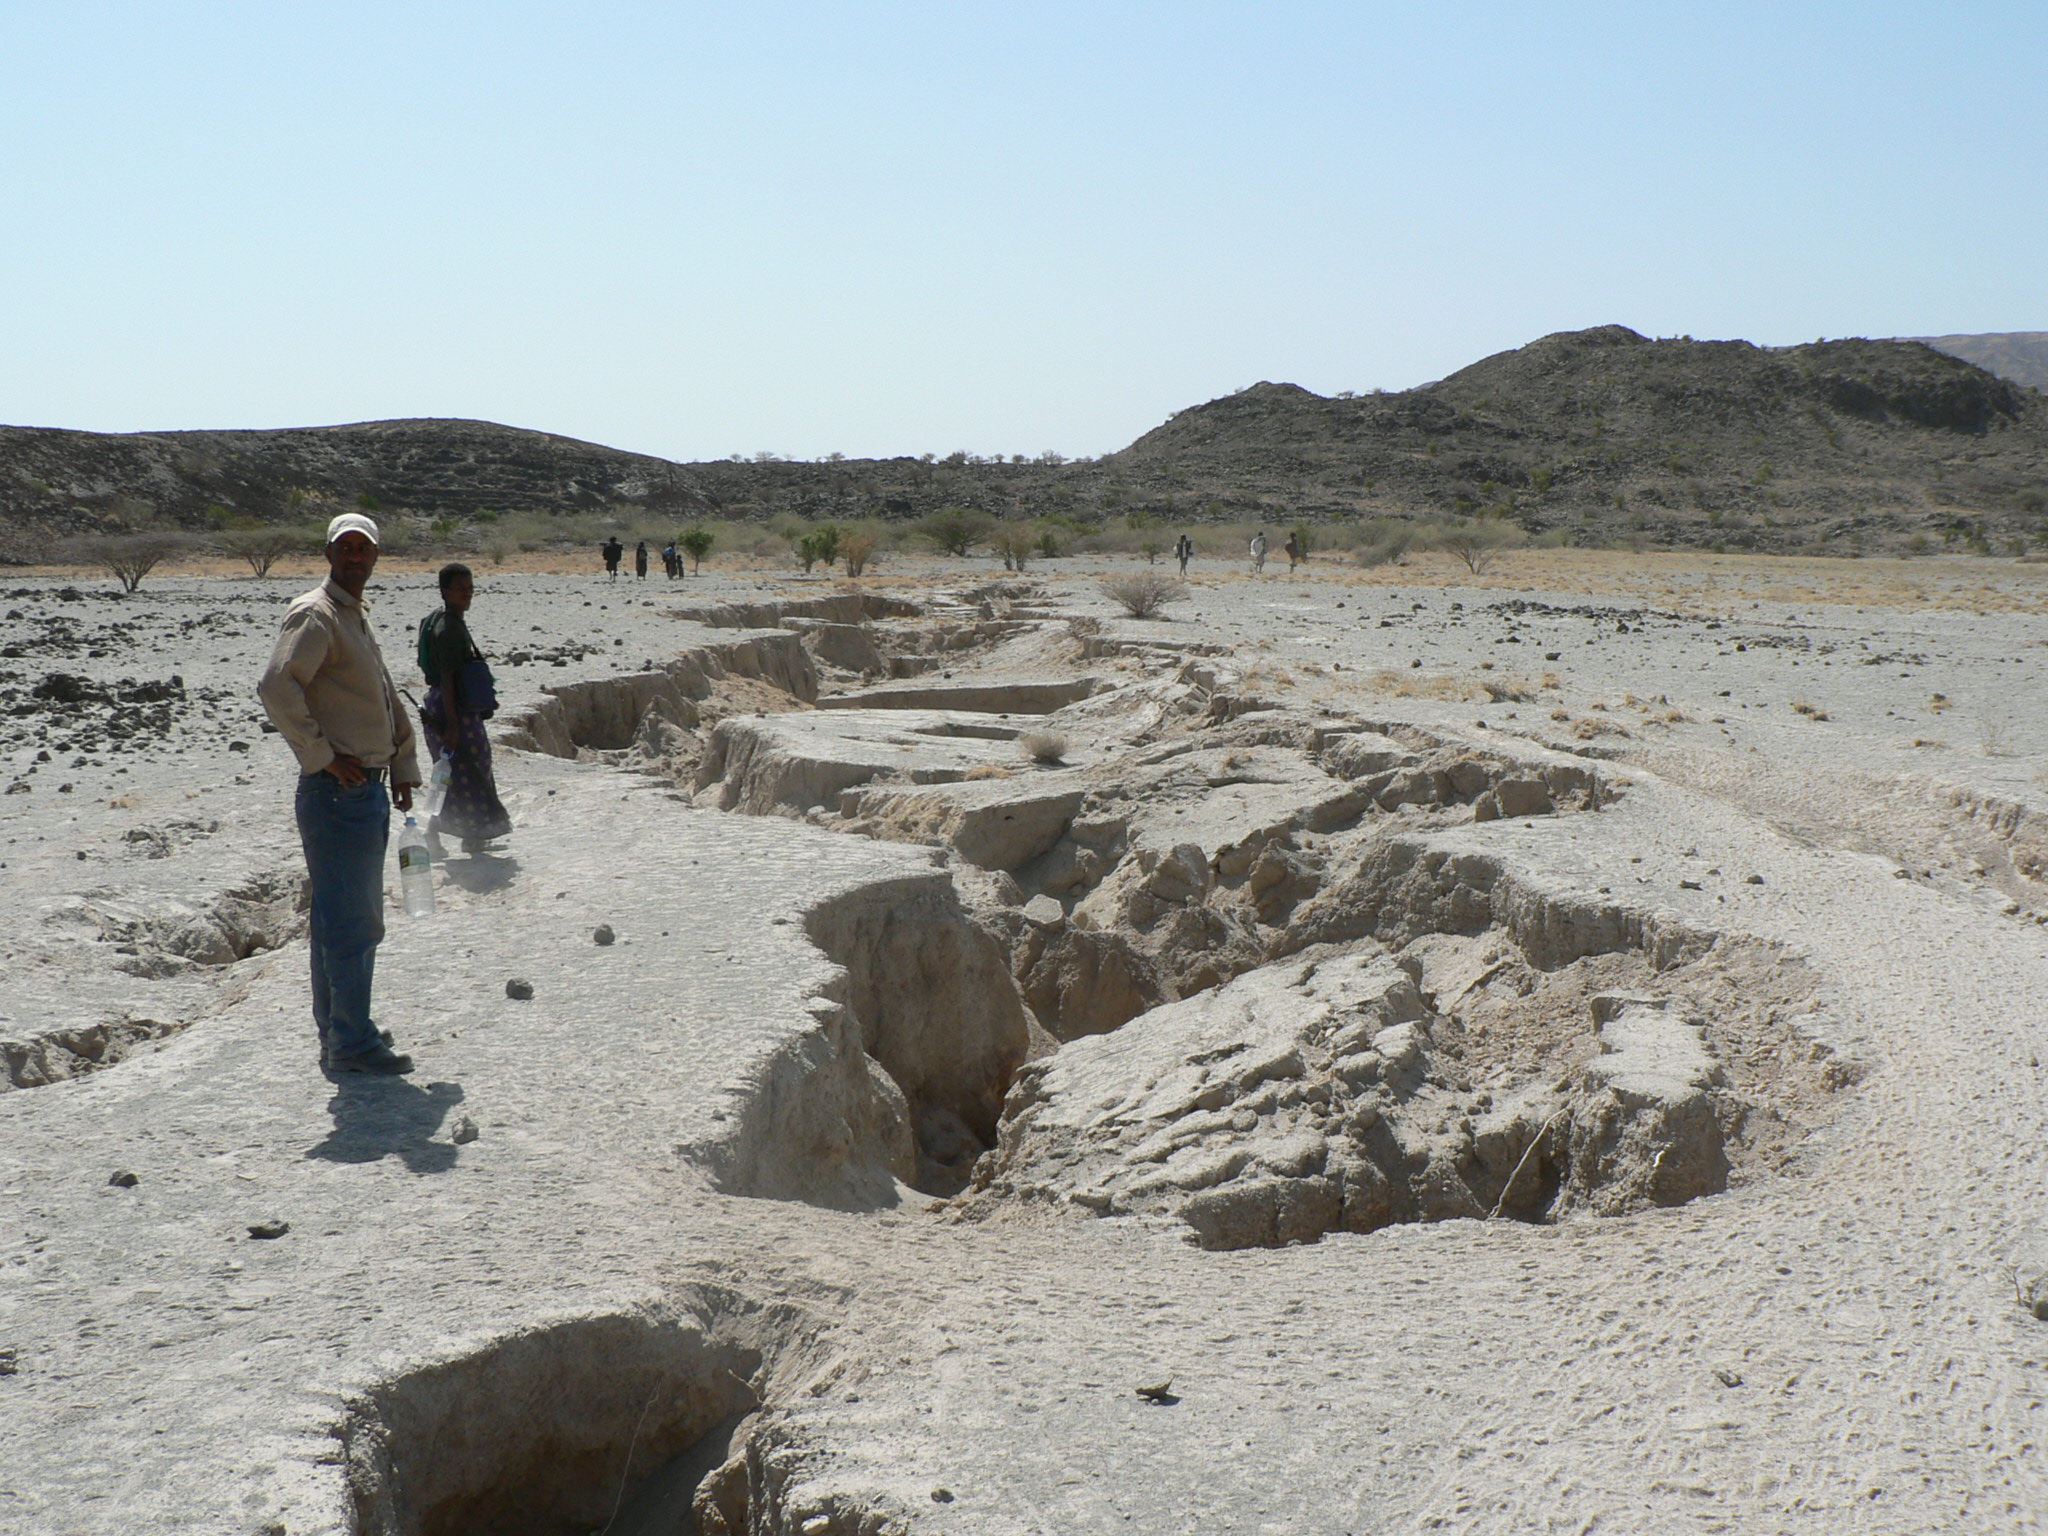
Figure 12: Feleke Worku, a surveyor from the Ethiopian Mapping Agency, examines a ground rupture created during the September rifting event. Photograph by Tim Wright, University of Leeds.
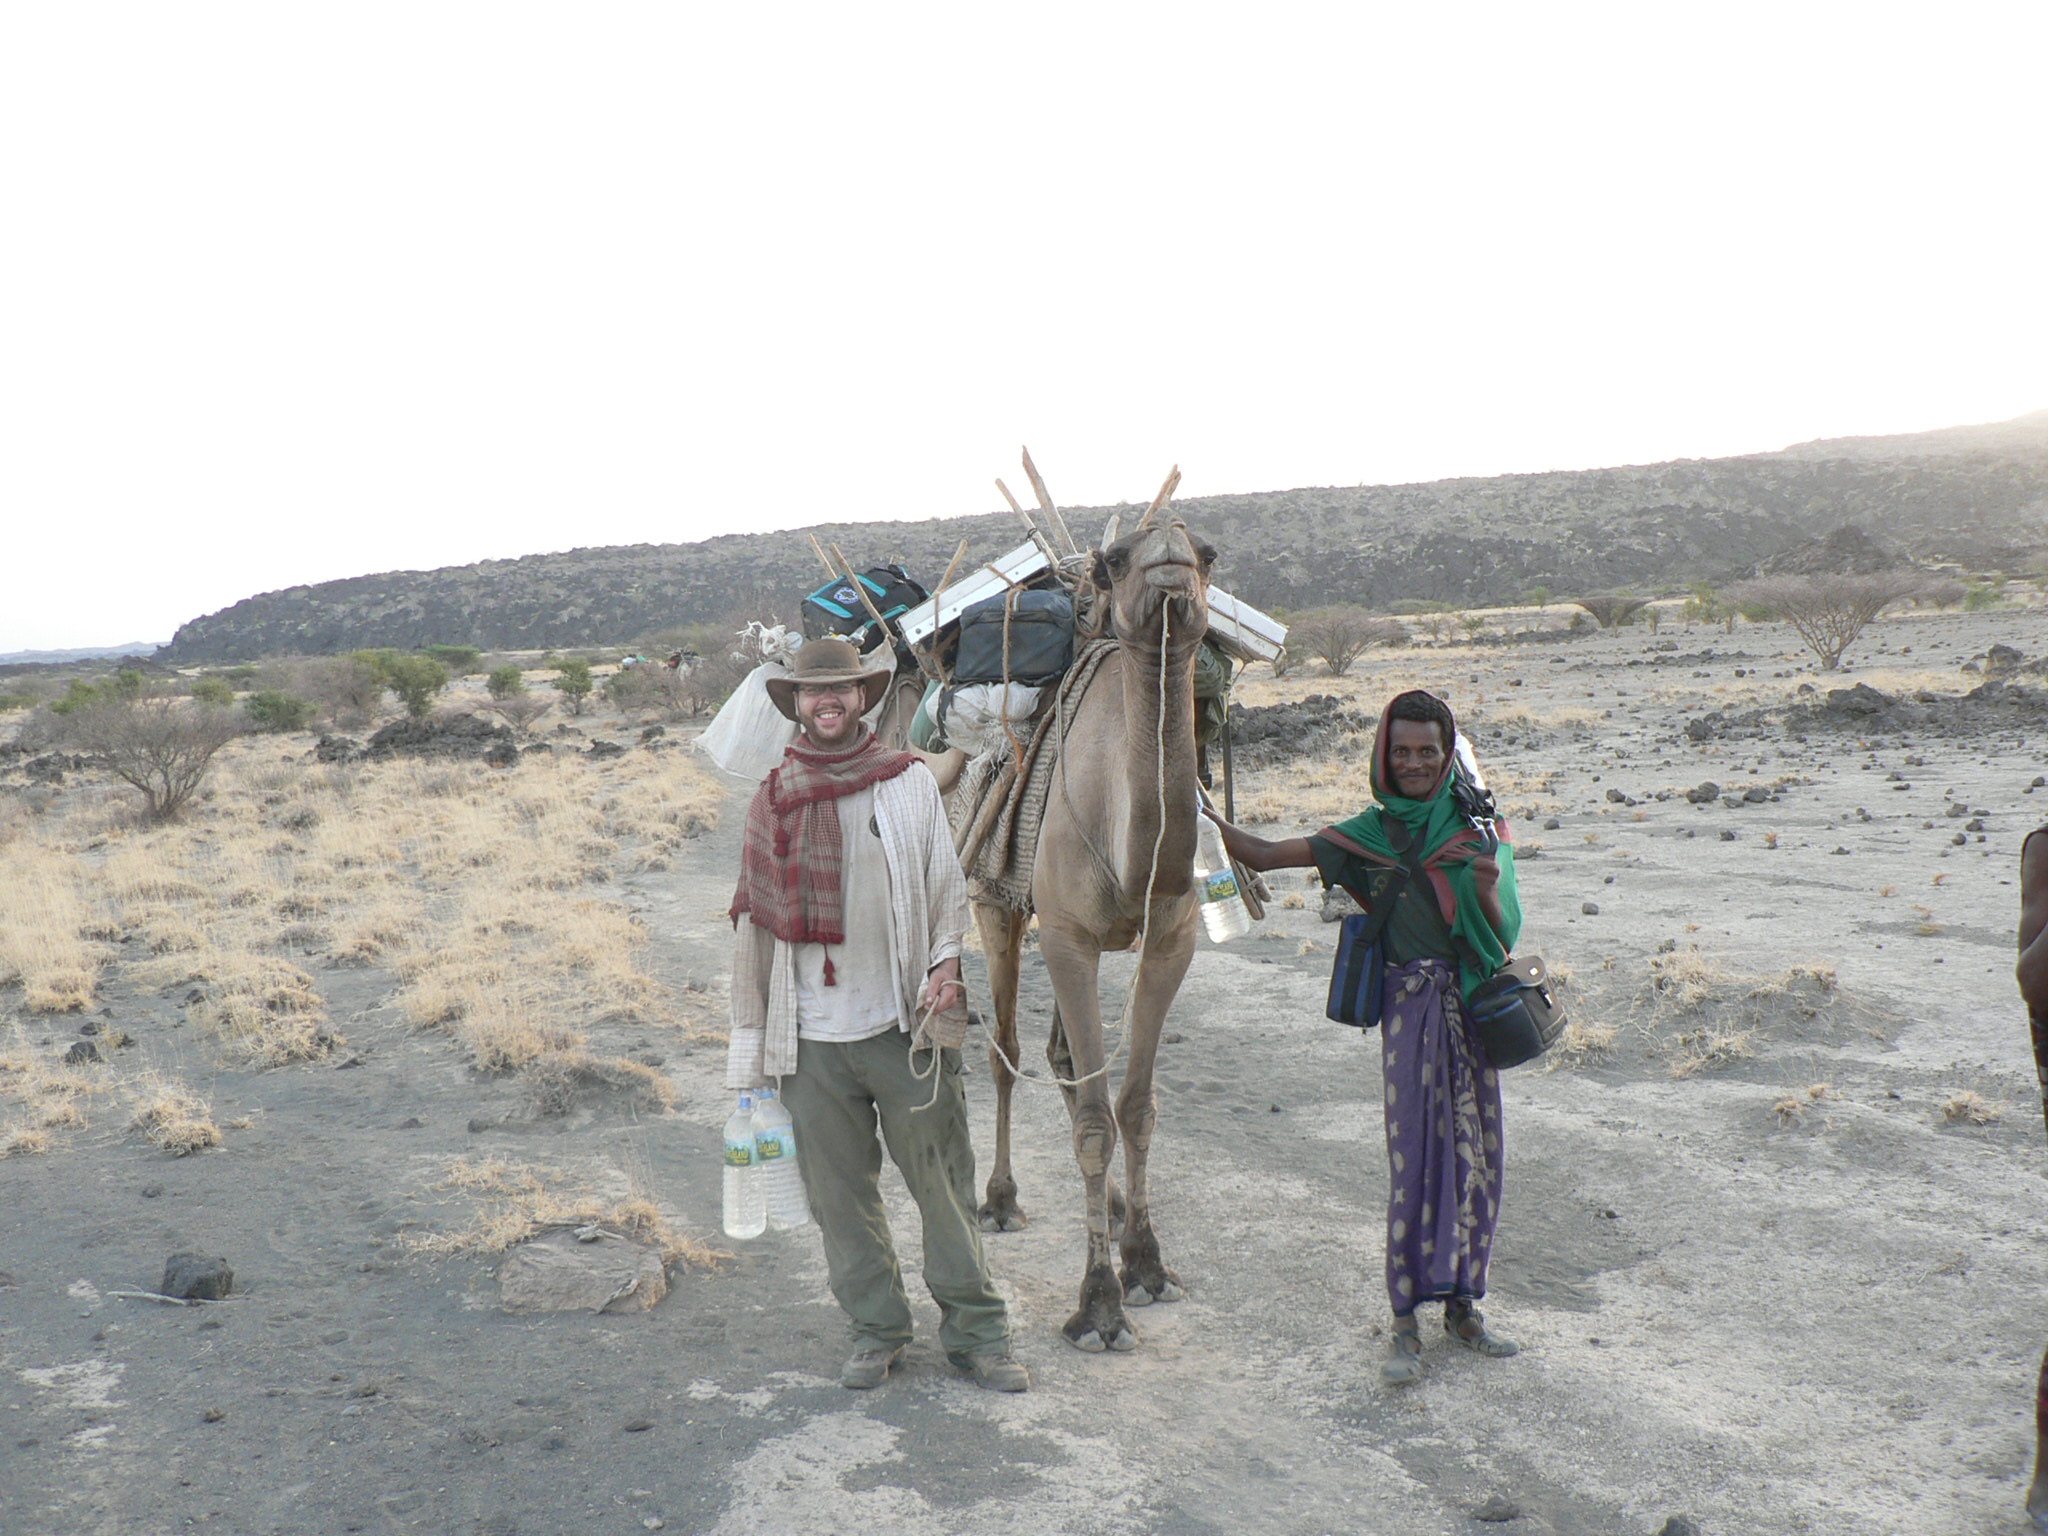
Figure 13: University of Bristol Scientist James Hammond bringing home the camels laden with seismic and GPS gear. Photo by Tim Wright, University of Leeds.